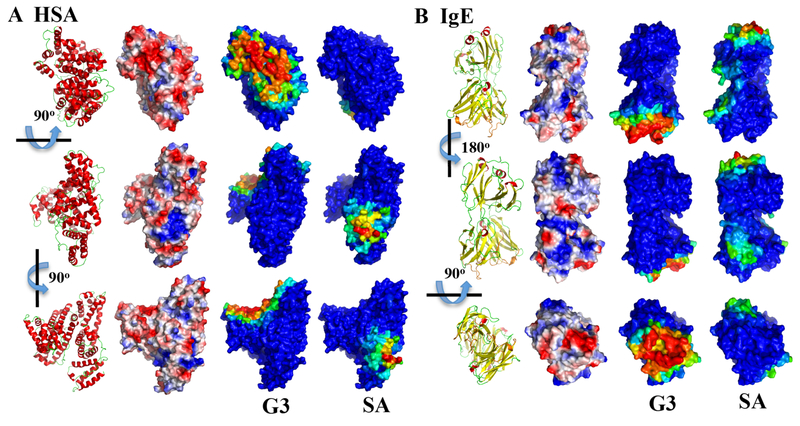
Figure 3. Mapping of protein residues with their binding frequencies to charged dendrimers.
Since all PAMAM G1-G4 had similar per residue binding profile (Fig. 2), only the PAMAM-G3 is shown here. For both (A) HSA and (B) IgE, three different views are shown as indicated by the rotation axes and angles. For comparison, the protein structures in cartoon representation (red for helix, yellow for strand, and green for loop) and the protein surface electrostatic potentials computed by the PyMol (colored from negative potential in red to positive potential in blue) are shown in the first and second column. For the binding with PAMAM-G3 and PAMAM-SA, protein surfaces are colored according to each residue’s binding frequency to the dendrimer, in rainbow colors from blue (low) to red (high).

