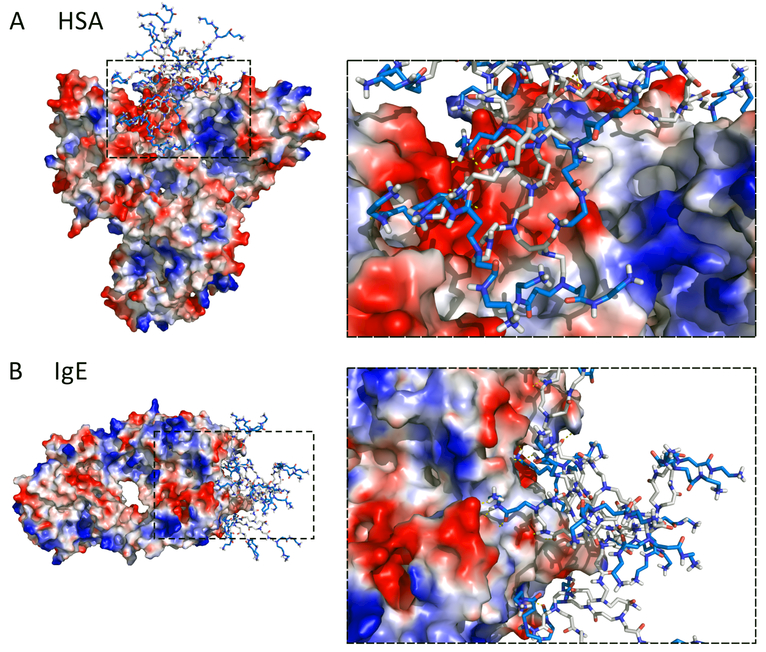
Figure 4. Snapshots of (A) PAMAM-G3-HSA and (B) PAMAM-G3-IgE complexes from DMD simulations.
The protein surfaces are colored from the negative electrostatic potentials in red to the positive potentials in blue. Accordingly, the positively charged surface groups of PAMAM are also colored in blue, while the hydrophobic dendrimer interior is colored in grey. Hydrgen bondsonds between PAMAM and proteins are denoted in yellow dashed-lines in zoom-in snapshots to the right.

