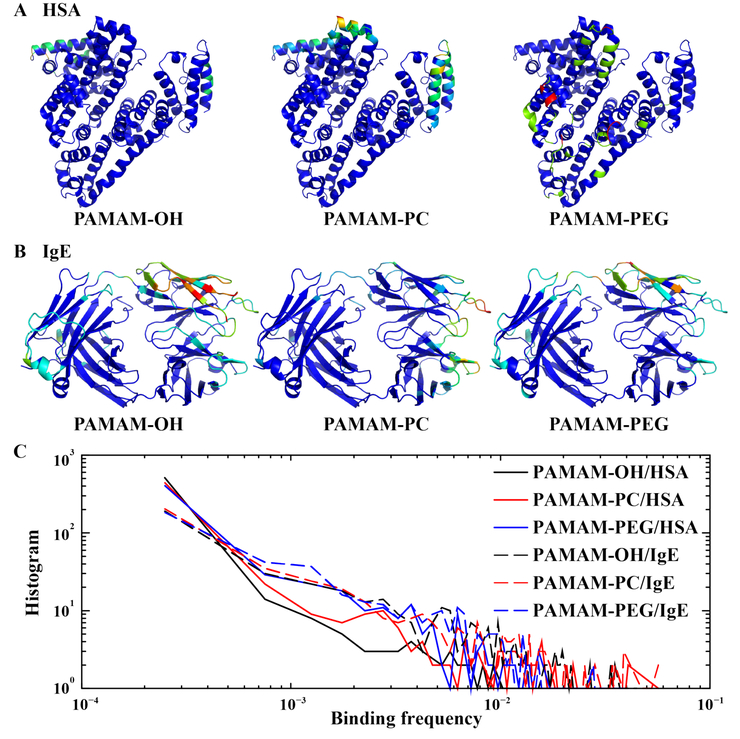
Figure 5. The binding of neutrally charged dendrimers with proteins.
Both (A) HSA and (B) IgE are shown in cartoon representation, and are colored according to each residue’s binding frequencies to the dendrimer in rainbow colors from blue (low) to red (high). (C) For each protein-dendrimer pair, the histogram of residue-wise binding frequencies computed from data in Fig. 2 is shown as a log-log plot.

