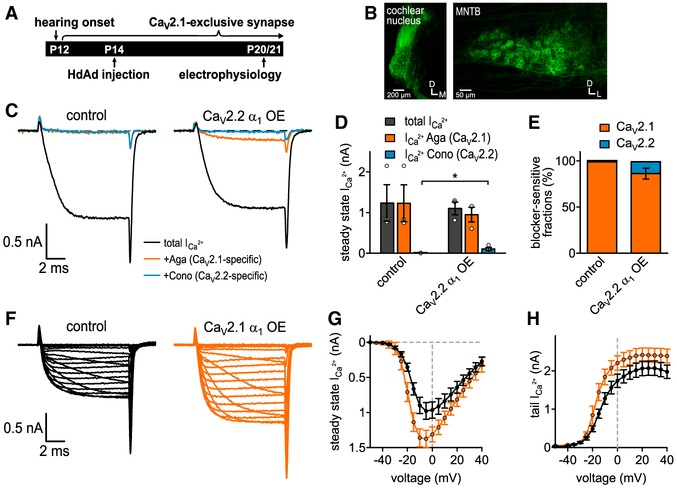
Figure 5. CaV2.2 α1 OE Results in Slight Loss of CaV2.1 Currents, while CaV2.1 α1 OE Results in an Increase in CaV2.1 Currents at P20/21 Calyx.
(A) Experimental timeline from virus injection into CN at P14 to electrophysiological recordings at P20/21.
(B) Confocal images of brainstem slices injected with CaV2.1 α1 OE construct. (Left) CN injection site. (Right) Contralateral MNTB with mEGFP-expressing calyx of Held terminals.
(C) Pharmacological isolation of CaV2 isoforms expressed in the presynaptic terminal at P21 in control (n = 3) and CaV2.2 α1 OE (n = 3). Average current traces before application of blockers (black), after applying 200 nM ω-agatoxin IVA to specifically block CaV2.1 (Aga, brown) and after applying 2 μM ω-conotoxin GVIA to specifically block CaV2.2 (Cono, blue).
(D) Ca2+ current amplitudes before blocker application (black, n.s., two-tailed t test), Aga-sensitive Ca2+ current amplitudes (brown, n.s., one-tailed t test), and Cono-sensitive Ca2+ current amplitudes (blue, 0.016, one-tailed t test).
(E) Relative Ca2+ current fractions sensitive to blockers.
(F) Average Ca2+-current traces to 10 ms step depolarizations from −80 mV holding to voltages between −50 and +40 mV for control (left, n = 9) and CaV2.1 α1 OE (right, n = 10).
(G and H) Current-voltage relationships of either peak Ca2+ currents (G) or tail Ca2+ currents (H). All data are shown as mean ± SEM. See also Table S4.

