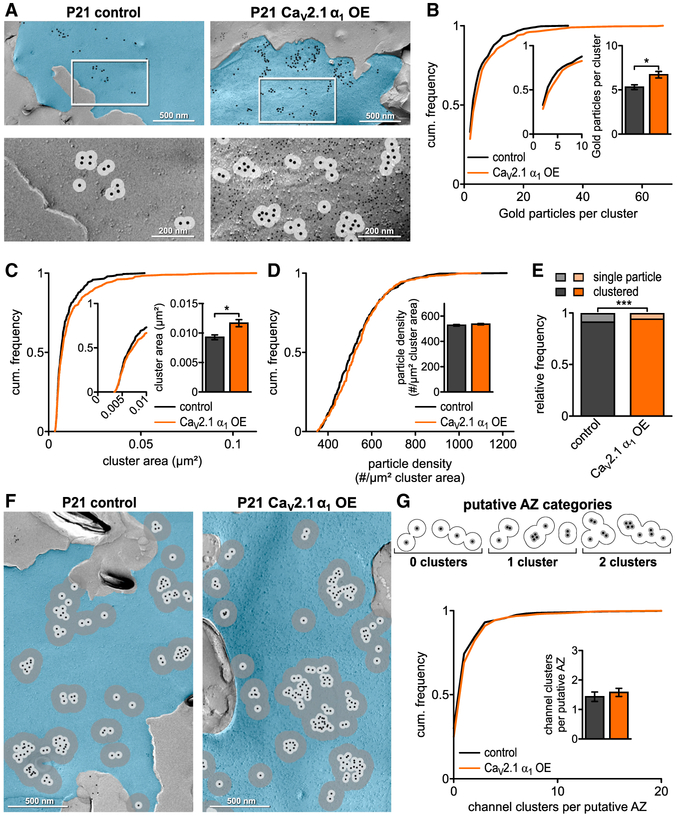
Figure 6. CaV2.1 α1 OE Increases CaV2.1 Channels and Cluster Area at the Putative AZ at P21 Calyx.
(A) Representative SDS-digested freeze-fracture immunogold labeled replicas of calyx P-faces (pseudocolored blue) of control and CaV2.1 α1 OE at P21. (Top) CaV2.1 distribution. Large gold particles (12 nm) label CaV2.1, small gold particles (6 nm) label mEGFP (CaV2.1 α1 OE only), and 30 nm circle indicates spatial uncertainty of CaV2.1 (light gray). (Bottom) High-magnification images of the boxed areas showing clustering of gold particles. Note that 12 nm gold particles have been enhanced for better visibility.
(B) Cumulative frequency distribution of gold particles per cluster; (insets) closeup of 0–10 particle clusters and corresponding bar graph (p = 0.0139, Mann-Whitney U test, n = 334 for control and n = 456 for CaV2.1 α1 OE).
(C) Cumulative frequency distribution of cluster area; (inset) closeup of 0–0.01 μm2 and corresponding bar graph (p = 0.0315, Mann-Whitney U test).
(D) Cumulative frequency distribution of gold particle density per μm2 cluster area; (inset) bar graph (p = 0.1080, Mann-Whitney U test).
(E) Relative frequency of single channels to channel clusters (p = 0.0003, Fisher’s exact test, n = 1,982 particles in 13 replicas for control and n = 3,307 particles in 10 replicas for CaV2.1 α1 OE).
(F) Representative SDS-digested freeze-fracture immunogold labeled replicas of calyx P-faces (blue) of control and CaV2.1 α1 OE at P21. Large gold particles (12 nm) label CaV2.1, small gold particles (6 nm) label mEGFP (control and CaV2.1 α1 OE only), 30 nm circle (light gray), and 100 nm circle (dark gray).
(G) (Top) Diagram of putative AZ categories. Cluster defined as overlap of at least two 30 nm circles and putative AZ as overlap of all 100 nm circles of clusters. (Bottom) Cumulative frequency distribution of channel cluster assembly within a putative AZ. (Inset) Number of clusters per putative AZ (p = 0.0663, Mann-Whitney U test, n = 230 for control and n = 285 for CaV2.1 α1 OE). All data are shown as mean ± SEM. EM images are a montage of multiple images assembled from the calyx P face area containing CaV2.1. See also Table S5.

