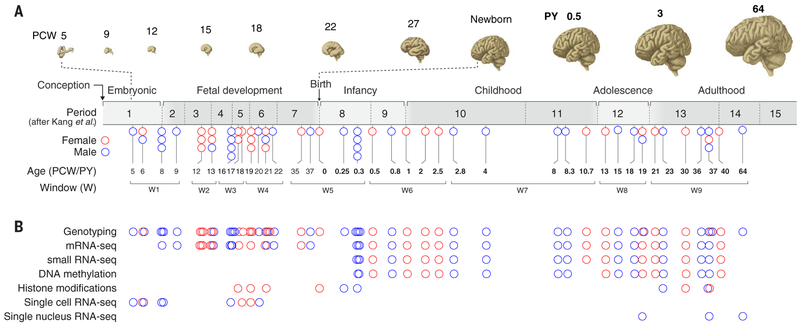
Fig. 1. Overview of the data generated in this study.
(A) The developmental time span of the human brain, from embryonic ages (≤8 PCW) through fetal development, infancy, childhood, adolescence, and adulthood, with PCW and PY indicated. Below is the distribution of samples in this study across broad developmental phases (embryonic to adulthood), age [5 PCW to 64 PY (19)], and developmental windows (W1 to W9). Each circle represents a brain, and color indicates the sex [red circles (female) and blue circles (male)]. (B) Postmortem human brains sampled for different data modalities in this study are indicated.

