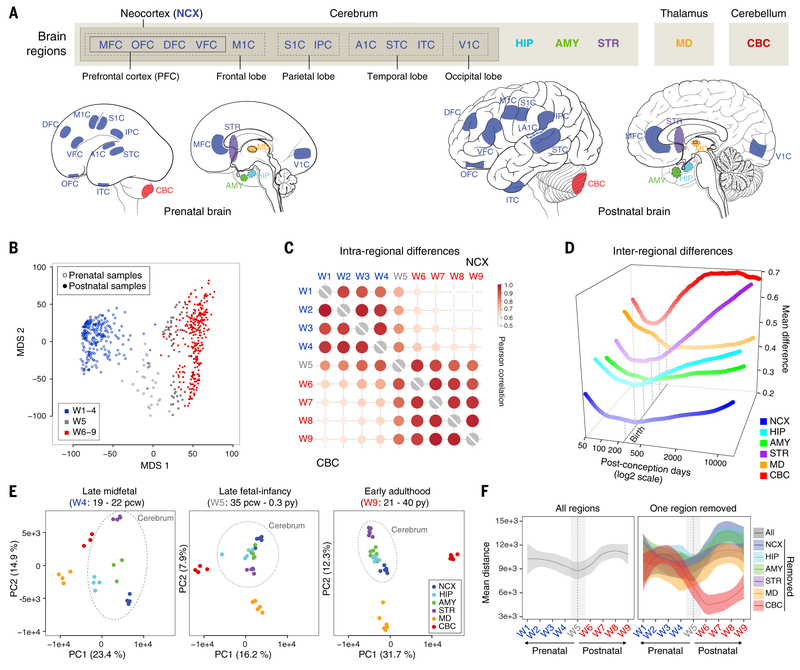
Fig. 2. Global transcriptomic architecture of the developing human brain.
(A) mRNA-seq dataset includes 11 neocortical areas (NCX) and five additional regions of the brain. IPC, posterior inferior parietal cortex; A1C, primary auditory (A1) cortex; STC, superior temporal cortex; ITC, inferior temporal cortex; V1C, primary visual (V1) cortex. (B) The first two multidimensional scaling components from gene expression showed samples from late fetal ages and early infancy (W5, gray) clustered between samples from exclusively prenatal windows (W1 to W4, blue) and exclusively postnatal windows (W6 to W9, red). (C) Intraregional Pearson’s correlation analysis found that samples within exclusively prenatal (W1 to W4) or postnatal (W6 to W9) windows correlated within, but not across, those ages. (D) Interregional transcriptomic differences revealed a developmental cup-shaped pattern in brain development. The interregional difference was measured as the upper quartile of the average absolute difference in gene expression of each area compared to all other areas. (E) AC-PCA for samples from all brain regions at late mid-fetal ages (W4), late fetal ages and early infancy (W5), and early adulthood (W9) showed that interregional differences were generally greater during W4 and W9 but reduced across W5. (F) Pairwise distance across samples using the first two principal components for all regions (left) or excluding one region at a time (right) demonstrated that the reduction of variation we observed is common across multiple brain regions, once the most differentiated transcriptomic profile (the cerebellum) is excluded. The shaded bands are 95% confidence intervals of the fitted lines.

