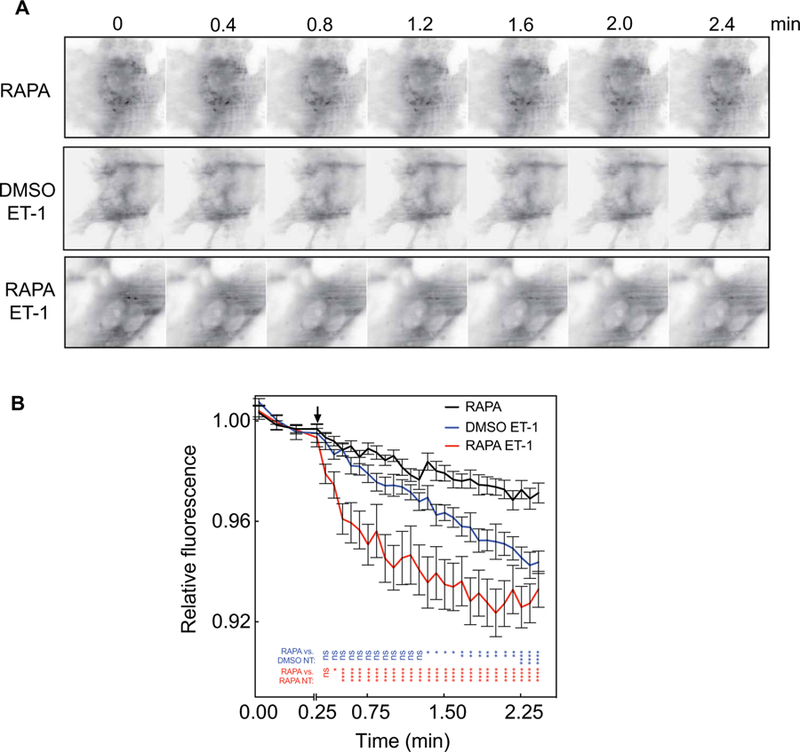
Fig. 3. ET-1 stimulates PI4P depletion even after removal of the bulk of PI4,5P2.

(A and B) MEFs were transduced with adenoviruses expressing the FKBP–5-phosphatase system and GFP-P4M and then were imaged by TIRF microscopy. Cells were treated with 1 μM RAPA or DMSO (vehicle) for 20 min, which was followed by the addition of 100 nM ET-1 or vehicle at the time indicated by the arrow. (A) Representative images of MEFs before and after treatment with 100 nM ET-1 with DMSO vehicle or 1 μM RAPA. (B) Time courses of PI4P depletion for combined experiments with six or seven cells analyzed for each condition in each of three independent experiments. All traces are means ± SEM. All curves are compared by two-way ANOVA with multiple comparisons within each row. P values represent RAPA, Ctrl compared to DMSO, ET-1–treated (blue) and RAPA compared to RAPA, ET-1–treated (red). *P < 0.05, **P < 0.01, ***P < 0.001, and ****P < 0.0001.
