
Fig. 4. NT-1 does not affect the amount of steady-state PM PI4,5P2 and causes only transient IP3 production.
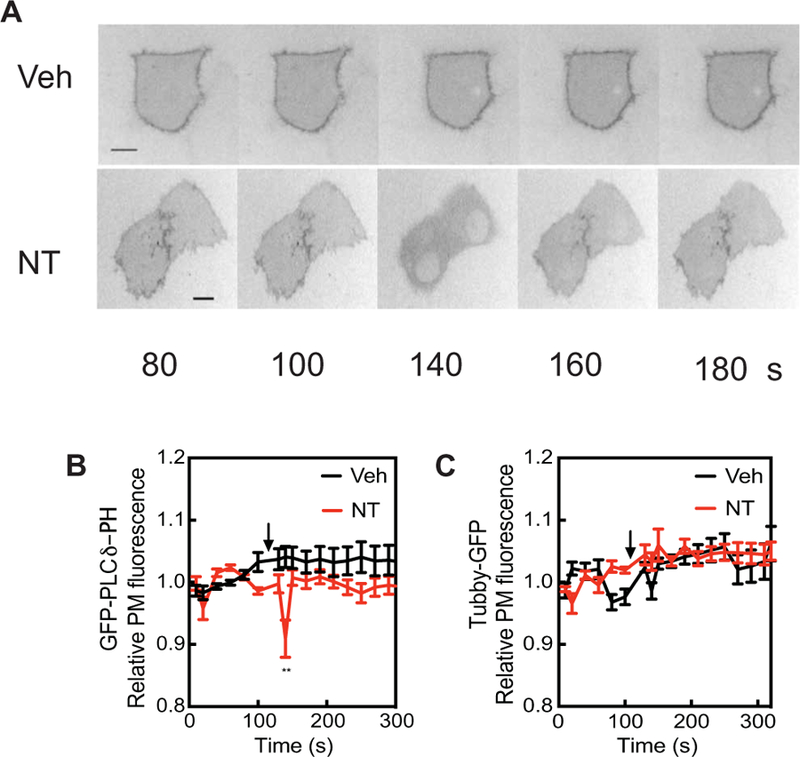
(A) PANC-1 cells were transfected with plasmid encoding the GFP-PLCδ-PH domain, treated with vehicle or 100 nM NT, and visualized by epifluorescence microscopy. Representative GFP images are shown. Time is seconds after beginning imaging. NT was added after 100 s. (B) Regions of interest containing GFP-PLCδ-PH fluorescence were identified and quantitated over time with ImageJ software. (C) Regions of interest containing Tubby-GFP fluorescence were identified and quantitated over time with ImageJ. Data in (B) and (C) are compiled from 10 cells in at least three independent experiments. All traces are means ± SEM. All curves were compared by two-way ANOVA with multiple comparisons within each row. **P < 0.01; values at all other time points were not statistically significant.