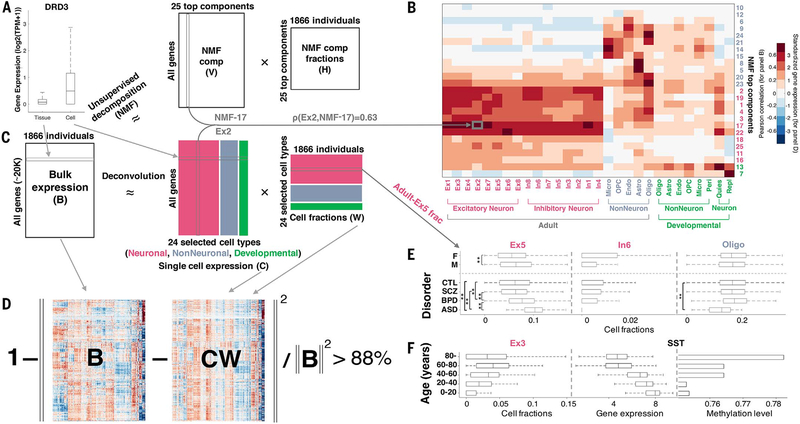
Fig. 2. Deconvolution analysis of bulk and single-cell transcriptomics reveals cell fraction changes across the population.
(A) Genes had significantly higher expression variability across single cells sampled from different types of brain cells than across equivalent tissue samples taken from a population of individuals. (Left) Dopamine gene DRD3. (B) The heatmap shows the Pearson correlation coefficients of gene expression between the NMF-TCs and single-cell signatures (for n = 457 biomarker genes) (15). Micro, microglia; OPC, oligodendrocyte progenitor cells; endo, endothelial cells; astro, astrocytes; oligo, oligodendrocytes; peri, pericytes; quies, quiescent cells; repl, replicating cells. (C) (Top) The bulk tissue gene expression matrix (B, genes by individuals) can be decomposed by NMF (see fig. S52). (Bottom) The bulk tissue gene expression matrix B can be also deconvolved by the single-cell gene expression matrix (C, genes by cell types) to estimate the cell fractions across individuals (the matrix W); i.e., B ≈ CW. The three major cell types analyzed are depicted with neuronal cells in red, nonneuronal cells in blue, and developmental cells in green, as highlighted by column groups in matrix C (also row groups in W). frac, fraction. (D) The estimated cell fractions can account for >88% of the bulk tissue expression variation across the population. (E) Cell fraction changes across genders and brain disorders. **Differences from control samples are significant (via a Kolmogorov-Smirnov test) after accounting for age distributions. See table S12 for more detail. CTL, control. (F) Changing cell fractions (for Ex3), gene expression (for SST), and promoter methylation level (median level, for SST) across age groups are shown. With increasing age, the fractions of Ex3 and Ex4 significantly increase, and some nonneuronal types decrease (Ex3 trend analysis, P < 6.3 × 10⁻¹⁰).

