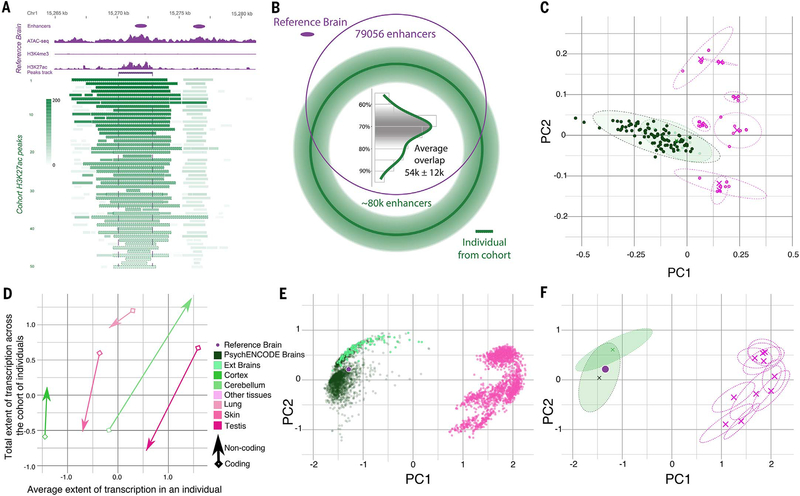
Fig. 3. Comparative analysis of transcriptomics and epigenomics between the brain and other tissues.
(A) Epigenetics signals of the reference brain (purple) were used to identify active enhancers with the ENCODE enhancer pipeline. The H3K27ac signal tracks at the corresponding enhancer region from each individual in the cohort are shown in green, with the gradient showing the normalized signal value for each H3K27ac peak. (B) The overlap of the H3K27ac peaks from an individual in the population with the reference brain enhancers is shown as a Venn diagram. The histogram shows the varying percentages of overlapped H3K27ac peaks across individuals. (C) The tissue clusters of RCA coefficients [principal component 1 (PC1) versus PC2] for chromatin data of any potential regulatory elements are shown. Clusters of PsychENCODE samples (dark green ellipses), external brain samples (light green ellipses), and other non-brain tissues (magenta ellipses) are plotted. (D) The extent of transcription for coding (arrowhead) and noncoding (diamond) regions. The average transcription extent (x axis) is shown compared with the cumulative extent of transcription across a cohort of individuals (y axis) for select tissue types, including the CB, cortex, lung, skin, and testis, by using polyadenylate RNA-seq data. (E and F) Similar to (C), but now for transcription rather than epigenetics. (E) RCA coefficients for gene expression data from PsychENCODE, GTEx brains, and other tissue samples are shown in dark green, light green, and magenta, respectively. (F) The center (cross) and ranges of different tissue clusters (dashed ellipses) are shown on an RCA scatterplot of (E).

