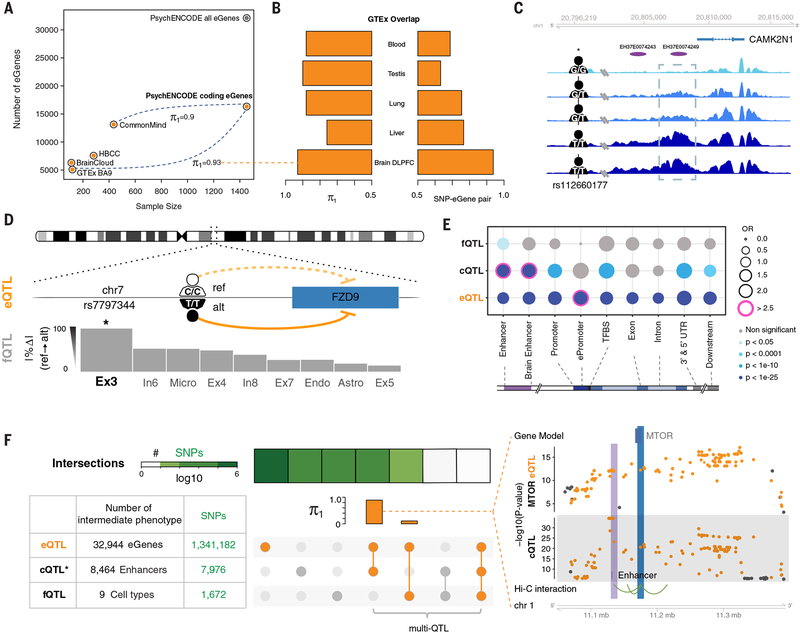
Fig. 4. QTLs in the adult brain.
(A) The frequency of genes with at least one eQTL (eGenes) is shown across different studies. The number of eGenes increased as the sample size increased. PsychENCODE eGenes are close to saturation for protein-coding genes. The estimated replication π1 values for GTEx and CMC eQTLs versus PsychENCODE are shown (36). (B) The similarity between PsychENCODE brain dorsolateral PFC (DLPFC) eQTLs and GTEx eQTLs of other tissues are evaluated by π1 values and SNP-eGene overlap rates. Both π1 values and SNP-eGene overlap rates are higher for brain DLPFC than for the other tissues. (C) An example of an H3K27ac signal across individuals in a representative genomic region, showing largely congruent identification of regions of open chromatin. The region within the dashed rectangle represents a cQTL; the signal magnitudes for individuals with a G/G or G/Tgenotype were lower than those for individuals with a T/Tgenotype. chr1, chromosome 1; rs, reference SNP. (D) An example of the mechanism by which an fQTL may affect phenotype. This fQTL overlaps with an eQTL for FZD9, a gene located in the 7q11.23 region that is deleted in Williams syndrome. The fQTL may affect the fraction of Ex3 by regulating FZD9 expression. Only Ex3 constitutes a statistically significant fQTL with this SNP (as designated by the asterisk). ref, reference; alt, alternate. (E) The enrichment of QTLs in different genomic annotations is shown. Pink circles indicate highly significant enrichment (P < 1 × 10⁻²⁵ and OR > 2.5). OR, odds ratio; TFBS, TF binding site; UTR, untranslated region. (F) Numbers of identified QTL-associated elements (eGenes, enhancers, and cell types) and QTL SNPs are shown in the bottom left table. Asterisks indicate that, for cQTLs, we show only the number of top SNPs for each enhancer. Overlaps of all QTL SNPs are shown in heatmaps (square rows). The linked circles show the overlap of QTL types. The intersections of other QTLs with eQTLs are evaluated by using π1 values in the orange bar plot. The greatest intersection is between cQTLs and eQTLs. An example is displayed on the right: the intersection of eQTL SNPs (for the MTOR gene) and cQTL SNPs (for the H3K27ac signal on an enhancer ~50 kb upstream of the gene). Hi-C interactions (bottom) indicate that the enhancer interacts with the promoter of MTOR, suggesting that the cQTL SNPs potentially mediate the expression modulation manifest by the eQTL SNPs.

