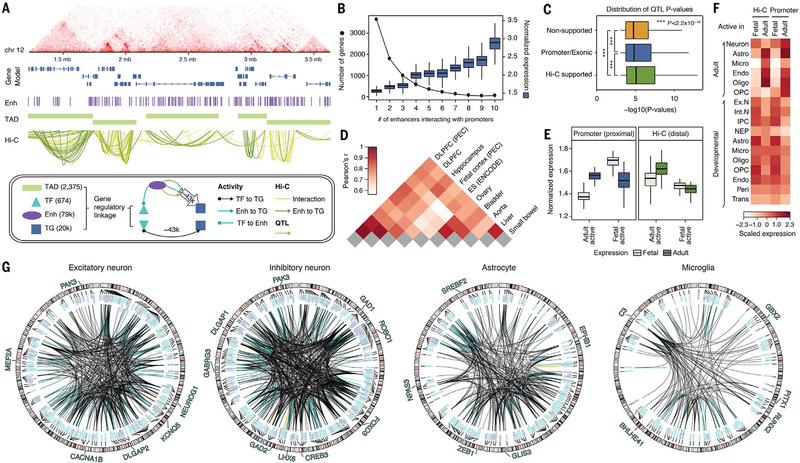
Fig. 5. Building a gene regulatory network (GRN) from Hi-C and data integration.
(A) A full Hi-C dataset from adult brain reveals the higher-order structure of the genome, ranging from contact maps (top) to TADs and promoter-based interactions. (Bottom) A schematic of how we leveraged gene regulatory linkages involving TADs, TFs, enhancers (Enh), and target genes (TG) to build a full GRN (fig. S42) and a high-confidence subnetwork consisting of 43,181 TF–to–target gene promoter and 42,681 enhancer–to–target gene promoter linkages (21). (B) We compared the number of genes (left y axis, dotted line) and the normalized gene expression levels (right y axis, boxes) with the number of enhancers that interact with the gene promoters. Boxes show means and SDs. (C) QTLs that were supported by Hi-C evidence (174,719) showed more significant P values than those that were not (promoter or exonic QTLs, 130,155; nonsupported QTLs, 1,065,311). (D) Cross-tissue comparison of chromatin architecture indicates that adult brains in PsychENCODE and Roadmap (e.g., DLPFC and hippocampus tissues) share chromatin architecture more than nonrelated tissue types. Fetal brain shows chromatin architecture distinct from that in adult brain, indicating extensive rewiring of chromatin structures during brain development. ES, embryonic stem cell. (E) Genes assigned to fetal active elements are prenatally enriched, whereas genes assigned to adult active elements are postnatally enriched. (F) Genes assigned to fetal active elements are relatively more enriched in neurons in the adult brain and fetal (developmental) brain, whereas genes assigned to adult active elements are relatively more enriched in glia (adult astrocytes, endothelial cells, and oligodendrocytes). Ex. N, excitatory neuron; Int. N, inhibitory neuron; IPC, intermediate progenitor cells; NEP, neuroepithelial cells; trans, transient cell type. (G) The circos plots show the linkages from the full regulatory network targeting the cell-type–specific biomarker genes. The biomarker genes for excitatory or inhibitory neuronal type are the biomarker genes shared by at least five excitatory or inhibitory subtypes (20). Selected TFs for particular cell types are highlighted.

