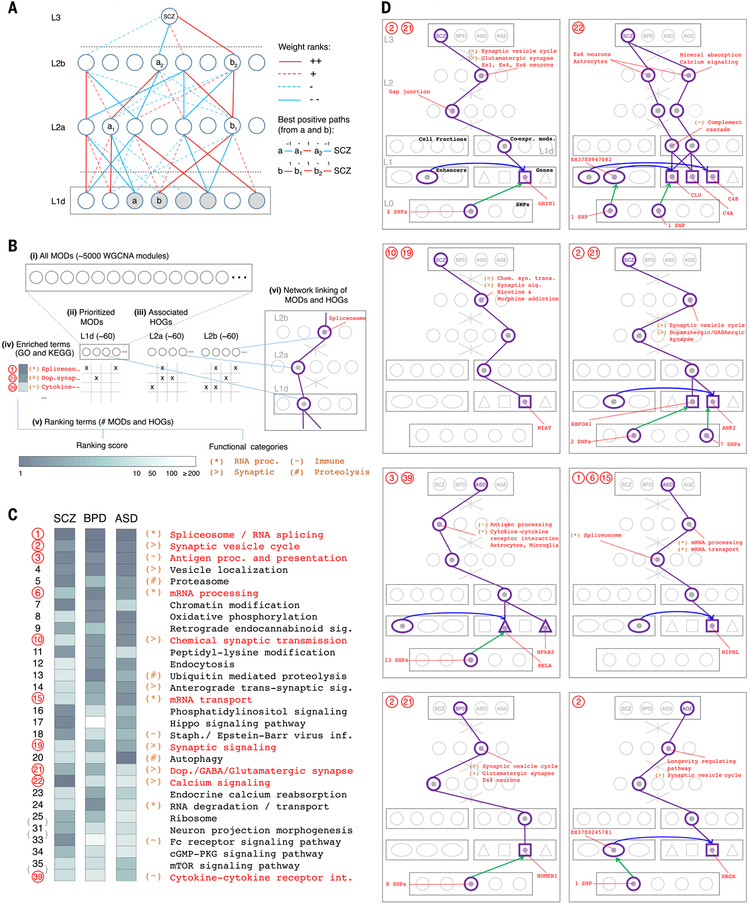
Fig. 8. Interpretation of the DSPN model highlights functional associations and shared disease mechanisms.
(A) The schematic illustrates the module (MOD) and higher-order grouping (HOG) prioritization schemes. Red and blue lines represent positive and negative weights, respectively, and full and dotted lines represent first and second ranks by absolute value [creating a directed acyclic graph (DAG) with branching factor 4, rooted at L3]. Highlighted nodes (gray) in L1d show positive prioritized MODs, for which a positive path (containing an even number of negative links) exists connecting the module to the SCZ node. a1/a2 and b1/b2 highlight “best positive paths” from a and b, respectively, to SCZ in terms of absolute rank score. Associated HOGs are defined for a1/a2, containing all nodes in L1d having a path in the DAG to a1 (respectively a2), which is identically signed to the best path from a to a1 (respectively a2) (21). Positive prioritized HOGs are associated with nodes on best paths from all positive prioritized MODs; negative prioritized MODs and HOGs are calculated similarly. (B) Summary of the functional annotation scheme. (i) A total of 5024 weighted gene coexpression network analysis (WGCNA) MODs (modules and submodules) are derived from multiple data splits. (ii) MODs are prioritized as in (A) for each disorder, and (iii) associated HOGs are calculated. (iv) Gene set enrichment analysis associates functional terms with all MODs and HOGs. (v) Terms are ranked per disorder by counting the number of prioritized MODs or HOGs they associate with, and broad functional categories are defined; (vi) prioritized MODs and HOGs are linked to potentially interesting genes, enhancers, and SNPs by using GRN connectivity. proc., processing. (C) Upper segment of cross-disorder ranking of Gene Ontology (GO) and Kyoto Encyclopedia of Genes and Genomes (KEGG) functional terms, where cross-disorder ranks are assigned by using the average per-disorder rank ordering. Ranking score levels and functional categories are as in the key in (B). Highlighted ranks and terms correspond to examples shown in (D). See fig. S49 for extended ranking. sig., signaling; staph., staphylococcus; inf., infection; dop., dopamine; cGMP-PKG, guanosine 3′,5′-monophosphate–cGMP-dependent protein kinase; int., interaction. (D) Examples of associations between prioritized MODs or HOGs and genes, enhancers, and SNPs for each disorder and age model. Associated functional terms and categories are as in (B). A table providing coordinates of eQTLs and cQTLs for all examples shown is provided in table S13. Chem. syn. trans., chemical synaptic transmission.

