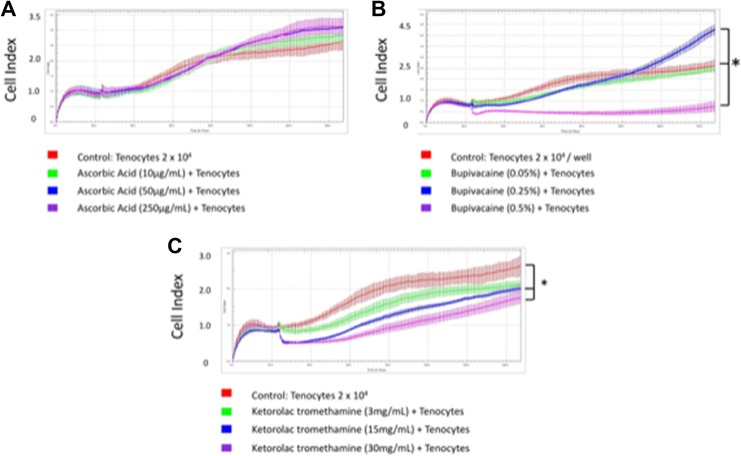
Figure 3.
Real-time changes in cell index when tenocytes were exposed to different concentrations of stimuli. A, Cell index when tenocytes were exposed to 10, 50, or 250 μg/mL ascorbic acid. B, Cell index when tenocytes were exposed to 0.05%, 0.25%, or 0.5% bupivacaine. C, Cell index when tenocytes were exposed to 3, 15, or 30 mg/mL ketorolac tromethamine. * P < .05.

