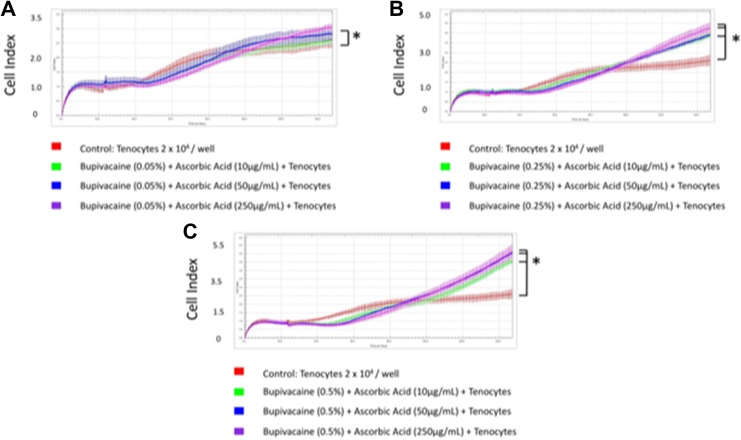
Figure 4.
Tenocytes exposed to different concentrations of bupivacaine and ascorbic acid. A, Cell index when tenocytes were exposed to 0.05% bupivacaine and 10, 50, or 250 μg/mL ascorbic acid. B, Cell index when tenocytes were exposed to 0.25% bupivacaine and 10, 50, or 250 μg/mL ascorbic acid. C, Cell index when tenocytes were exposed to 0. 5% bupivacaine and 10, 50, or 250 μg/mL ascorbic acid. * P < .05.

