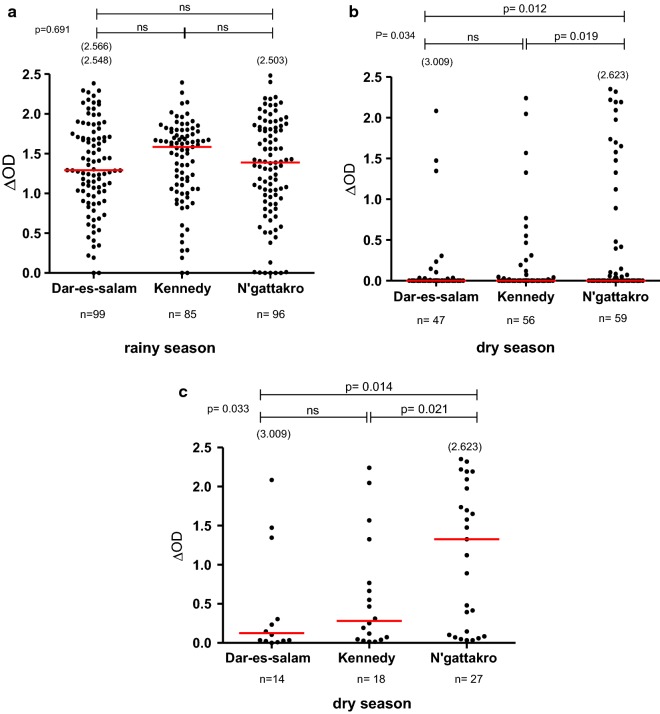
Fig. 2.
Comparison of IgG level with gSG6-P1 salivary peptide between neighbourhoods. Dot plots show the individual specific IgG level (∆OD value) to gSG6-P1 in the children of the neighbourhoods studied between the seasons: in the rainy season (n = 281; a) and the dry season (n = 161; b) for the whole “immune responders and not responders to the peptide gSG6-P1” population and for the only immune responders to gSG6-P1 (n = 59; c). Bars indicate the median value in each group. The number in parentheses on the figure above the dot plots indicates values above ∆OD = 2.5. The statistical results using the nonparametric Kruskal–Wallis test are indicated between the groups studied

