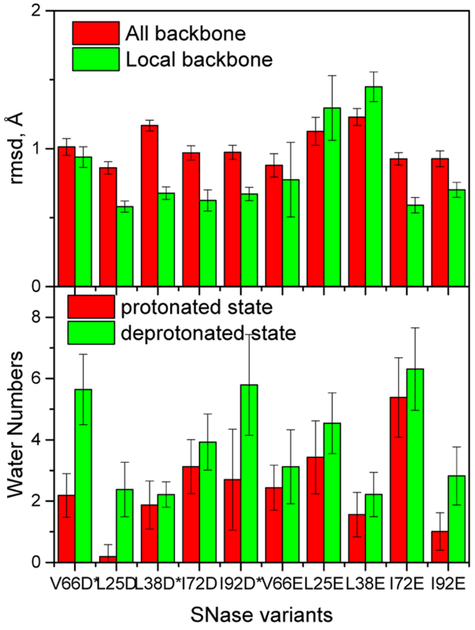
Figure 2.
Conformational changes (top panel) and penetrated water molecules (bottom panel) around the ionizable groups. The root-mean-square deviations (rmsd) are calculated against the X-ray structures. Local residues are those with any atom within 6 Å from the ionizable groups. Penetrated water molecules are counted within 6 Å from the ionizable groups. The error bars represent the standard deviations of the water numbers.

