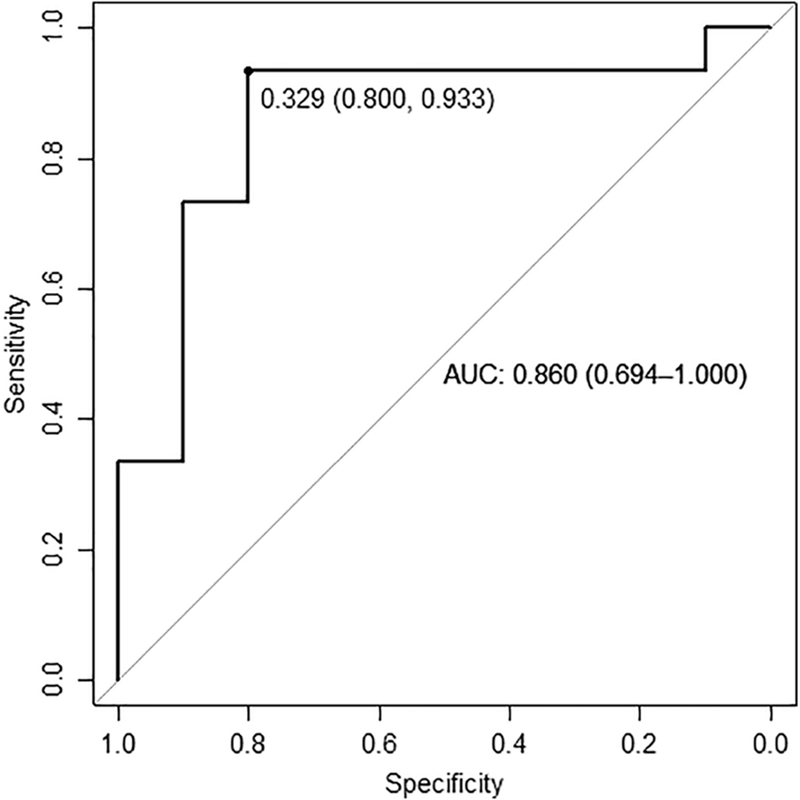
Figure 3.
ROC curves of DNA methylation level at probe cg06872964 within the IFI44L promoter in the primary APS cohort as compared to the SLE cohort. Optimal threshold per Youden index is shown as a point along the curve, with specificity and sensitivity in parentheses respectively. Area under the curve is also shown with 95% confidence interval.

