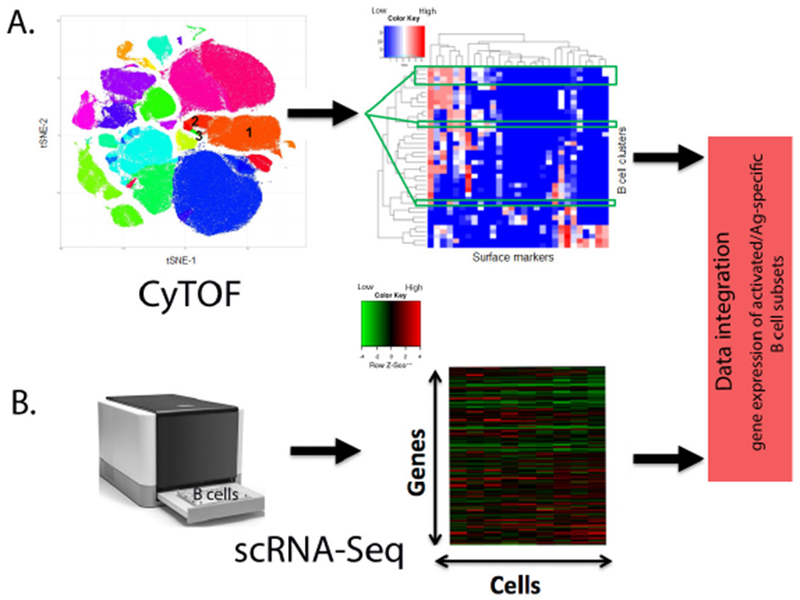
Fig. 2.

CyTOF and scRNA-Seq analysis of B cell subsets after vaccination.
A) Schematic representation of CyTOF. t-SNE plot of cell clusters defined by cellular markers. The annotation of the numbered cell clusters is as follows: 1. naïve B cells; 2. memory B and 3. plasmablasts. For clarity only three of the relevant B cell clusters are shown. Heat map displaying the expression levels (blue=low, red=high) of each cell surface marker in columns and each B cell cluster of interest in rows. B) Schematic representation of scRNA-Seq. Heat map displaying the gene expression levels (green=low, red=high) within single B cells (assay cell input is purified B cells). Data integration allows for the identification of gene expression signatures within activated and/or antigen-specific B cell subsets after vaccination.
