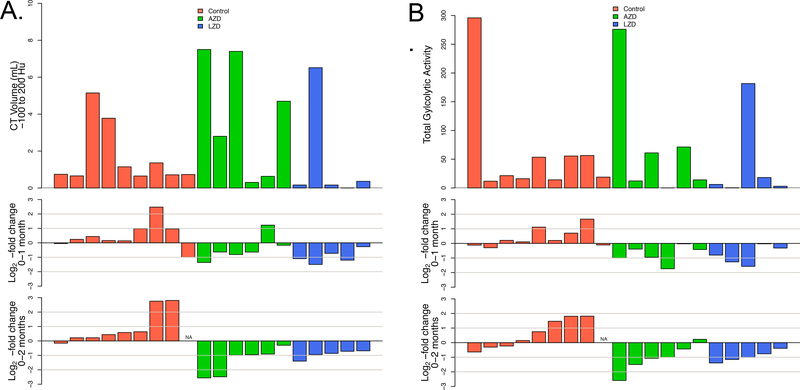
Fig. 2. Radiologic response rates of oxazolidinone-treated animals by treatment group.
(A) Volume of “hard” abnormal CT density (−100 to 200 HU) for each animal at baseline (top panel), log2-fold change from baseline to one month (middle panel), log2-fold change from baseline to two months (bottom panel). (B) Total glycolytic activity (TGA) for each animal at baseline (top panel), log2-fold change from baseline to one month (middle panel), log2-fold change from baseline to two months (bottom panel).

