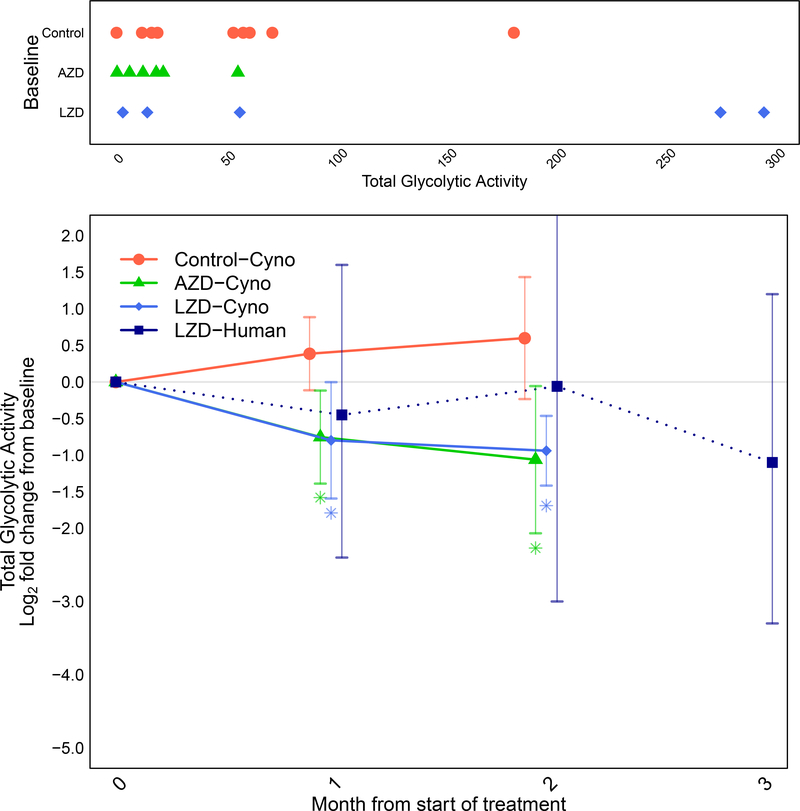
Fig. 5. Comparison of radiologic response rates in humans and macaques by PET.
(Top) Baseline extents of disease in individual animals by treatment group showing the total glycolytic activity (TGA) in all areas of FDG uptake. (Bottom) Longitudinal changes in average log2-fold change (and 95% confidence intervals) in TGA relative to baseline by treatment group for non-human primates and humans (linezolid treatment only). Colored asterisks indicate statistical significance relative to control arm mean (*P<0.05). Dotted line connecting human linezolid values indicates that different subjects were represented by their mean values at months 1, 2 and 3.

