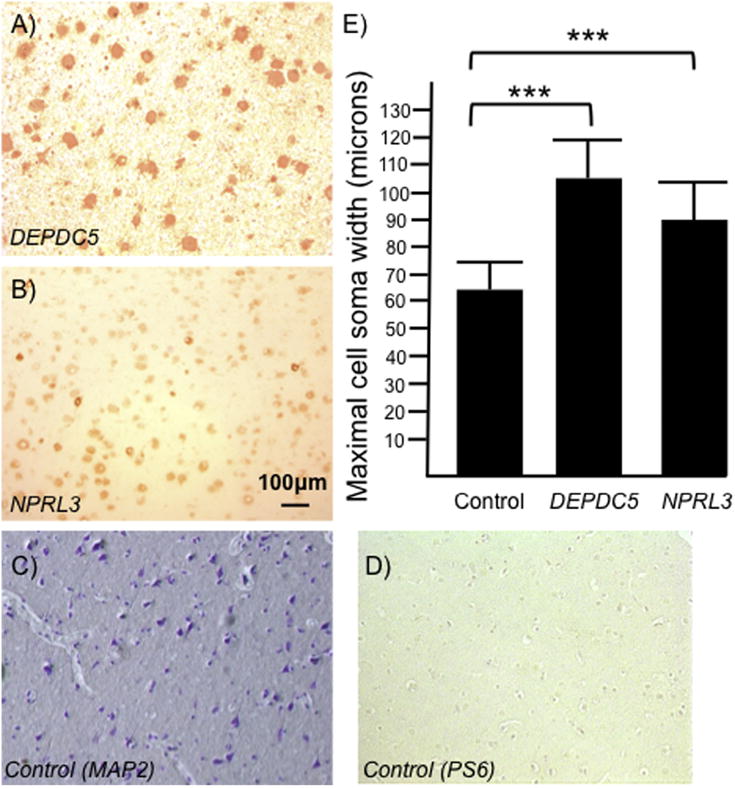
Figure 1. Enhanced cell size in human DEPDC5- or NPRL3-associated brain tissue specimens.

There is an increase in maximal cell soma width standard error of the mean (±SEM) in PS6 (Ser 235/236) immunoreactive neurons in resected specimens from individuals with DEPDC5 (A; n=2) and NPRL3 (B; n=2) mutations compared with age-matched post-mortem control layer V neurons (measured by MAP2 staining; C and D; n=2). Cells from the DEPDC5 specimen were 1.6 times larger than control (E; n=1500 cells per group; p < 0.001) and cells from the NPRL3 specimen were 1.4 times larger than control (E; 1500 cells per group, p < 0.001). Scale bar in (B) applies to all micrographs. *** = significantly different from control with a p < 0.001.
