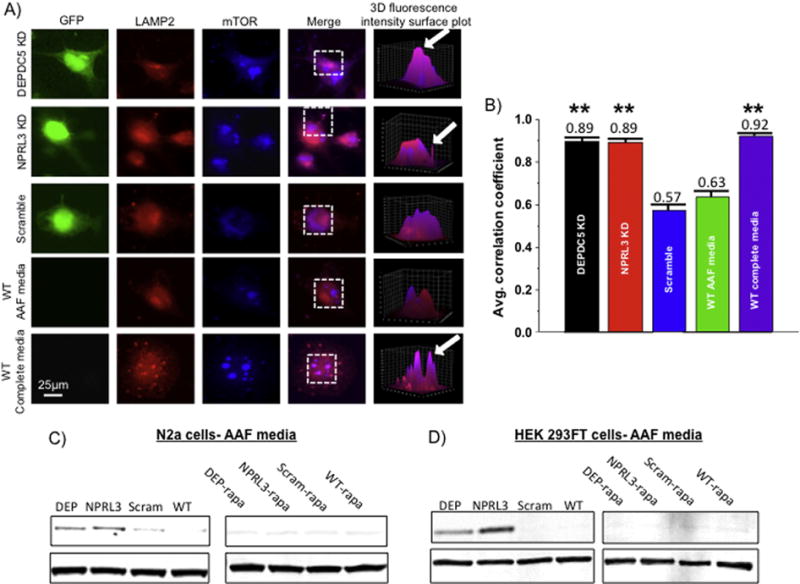
Figure 8. DEPDC5 or NPRL3 KD promote constitutive changes in subcellular mTOR localization and enhanced PS6 levels during amino acid deprivation.

Colocalization analysis was performed on DEPDC5 KD, NPRL3 KD, scramble control, and wildtype N2aC in amino acid free (AAF) or amino acid replete (complete) media (A). A fluorescence intensity surface plot was generated (see 3D reconstruction) for each region of interest (dashed boxes). Areas of pink represent colocalization of mTOR (blue) and the lysosomal membrane protein 2 (LAMP2, red). To quantify fluorescence, a Pearson’s correlation coefficient (R) was calculated for each cell and then averaged across all cells in a group (n= 10 per group). Statistical significance was determined using ANOVA. mTOR and LAMP2 were colocalized after DEPDC5 or NPRL3 KD and incubation in AAF media (B). Reduced colocalization was observed in scramble control and wildtype N2aC after incubation in AAF media (B). High degrees of colocalization between mTOR and LAMP2 were observed in wildtype N2aC incubated in complete media (B). In AAF media, DEPDC5 and NPRL3 KD in both N2aC (C) and HEK293FT cells (D) resulted in elevated levels of PS6 while scramble control and wildtype cells display little or no S6 phosphorylation. Rapamycin application after KD and amino acid starvation dramatically reduced PS6 levels. Western blots performed in duplicate. Densitometry data are in Supplemental Fig. 5. LAMP2= lysosome associated membrane protein 2, mTOR= mechanistic target of rapamycin, GFP= green fluorescent protein, AAF= amino acid free. Area of 3D reconstruction (ROI) is noted by the dashed boxes in the ‘merge’ column. ** = significant difference between scramble and WT control with a p < 0.01.
