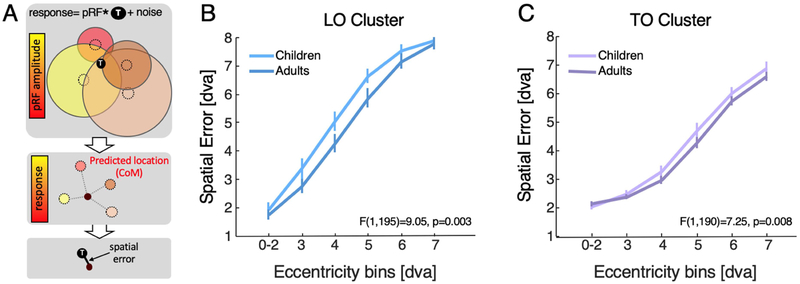
Figure 6: Spatial error by pRFs spanning LO and TO map clusters decreases with age.
(A) Schematic of the simulation to predict a target’s location in the visual field relative to its actual location ‘T’. Top: Colored circles represent pRFs, black circle represent target; response is estimated by convolving each pRF with the target and adding Gaussian random noise; responses are weighted by variance-explained; Middle: predicted location is the center of mass (CoM) of pRF responses across their locations. Bottom: spatial error is distance between predicted location and target location. (B) Spatial error in LO averaged in each binned ring of eccentricity across the visual field bilaterally in each subject in degrees of visual angle (dva) (C) Same as B, but for TO. Error bars represent standard error across subjects. Ns: LO, Children=16, Adults=21; TO, Children=14, Adults=20.

