
Figure 1.
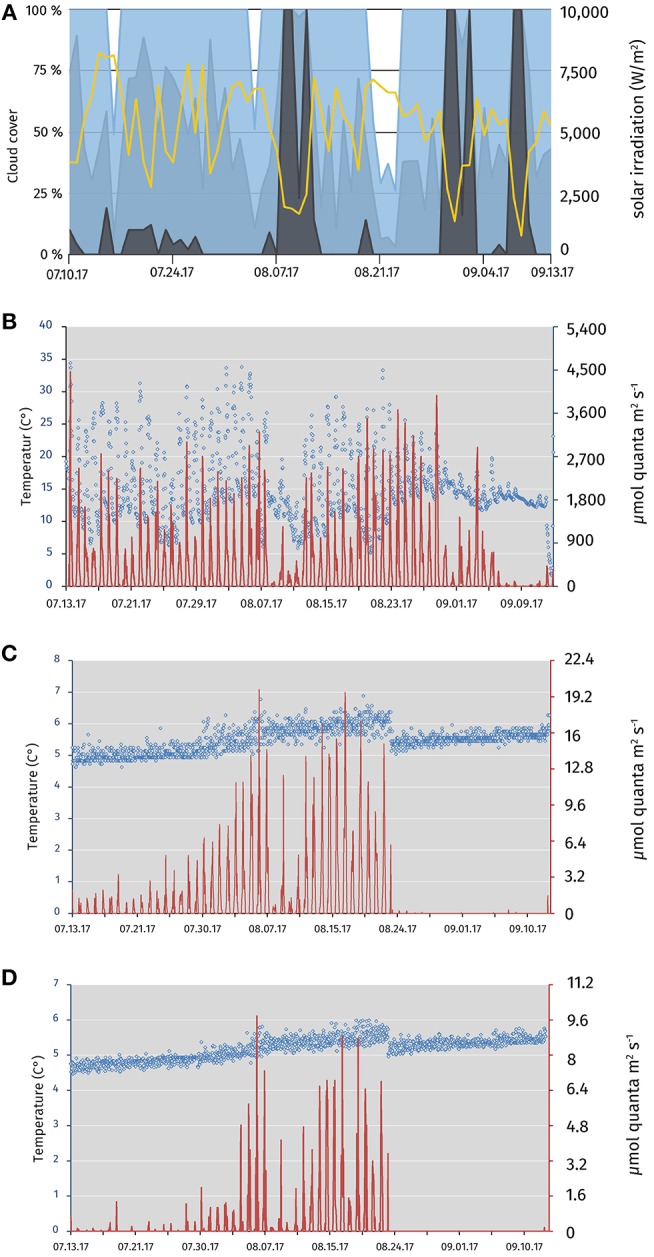
Meteorological data for the Piora valley, temperature, and relative light availability at different depths of the mooring in Lake Cadagno from July 13 to September 13 2017. (A) Sun light and cloud cover graph for the Piora valley from July 13 to September 13 2017. Data from meteoblue.com (yellow; sum of the daily shortwave radiation in W m−2, blue; maximal daily cloud cover in%, light blue; mean daily cloud cover in%, gray; minimal daily cloud cover in %). (B) Temperature (blue circles) and average light available at midnight/mid-day (red line) at the surface buoy of Lake Cadagno. The data logger was partly immersed in water, dampening the light and temperature readings (see values in August). (C) Relative light availability and temperature profile at midnight/mid-day of the two HOBO loggers at the top of the rig at 12 (July 13–August 23 2017) and 14 m depth (August 23–September 13 2017), respectively. A steady increase in average temperature and light availability from July to August is visible. The increase in the available light can be explained through the downward movement of photosynthetic bacteria over the season (see Figure S4) Re-positioning of the rig on the August 23 2017 results in both, a drop in temperature, and light availability. Available light was reduced to an average of 0.4 μmol m−2 s−1. (D) Relative light availability and temperature profile at midnight/mid-day of the two HOBO loggers at the bottom of the rig at 12.4 (July 13–August 23 2017) and 14.4 m depth (August 23–September 13 2017), respectively. Low light availability and temperature are characteristic for the depth of around 12.4 m. As in (C), temperature and available light values are steadily rising from July to August. No light was detected during daytime at 14.4 m depth after repositioning in August. Data was logged in hourly intervals for (B–D).