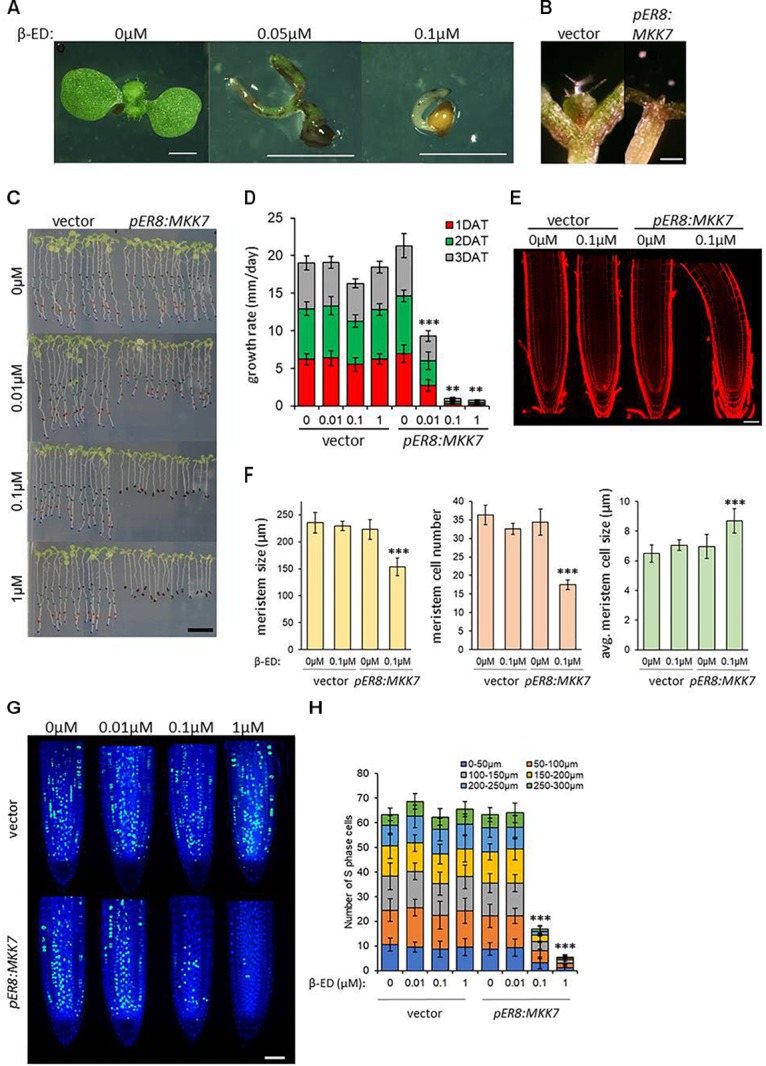
FIGURE 3.

Induced overexpression of MKK7 impairs development and meristem organization in Arabidopsis. (A) pER8:MKK7 (β-estradiol inducible) seeds germinated in the absence or in the presence of 0.05 and 0.1 μM β-estradiol. Scale bars: 2 mm. (B) Effect of induced MKK7 overexpression on leaf outgrowth during seedling de-etiolation. Empty-vector transformant and pER8:MKK7 seedlings were germinated in darkness for three days then transferred to 1 μM β-ED-containing media and exposed to continuous light for further 3 days. Scale bars: 250 μm. (C,D) Root growth arrest in response to induced MKK7 overexpression. Six-day old seedlings of empty vector and inducible MKK7 overexpression lines were transferred to β-estradiol containing media at the indicated concentrations. The positions of the root-tips were marked daily for a three-day period. Scale bar = 10 mm. Root growth rate after transfer to β-estradiol-containing growth medium (D). About 40 seedlings were measured for each sample. Error bars indicate standard deviation, asterisks indicate level of significance. (E,F) Root meristems at ∼16 h after transfer to ±0.1 μM β-estradiol. Representative images are shown in panel (E), the roots are aligned by the position of the quiescent center (QC). Scale bar = 50 μm. Cell length was measured longitudinally from the quiescent center cells on left-hand side of the root. Root meristem length, number of meristematic cells and average meristematic cell size of empty vector and pER8:MKK7 lines were measured at ∼16 h after transfer to ±0.1 μM β-estradiol (F). Seven to ten seedlings were measured for each sample. Error bars indicate standard deviation, asterisks indicate level of significance. (G) representative micrographs showing cells in S-phase by EdU labeling (green) in the root meristem ∼16 h after transfer to β-estradiol concentrations indicated. Nuclei are counterstained with DAPI (blue). Scale bar = 50 μm. (H) Quantification of S-phase cells in the root-tip. Cell counting was performed in 50 μm sections in 300 μm regions upwards from the QC. About 20 roots were quantified for each sample. T-tests were performed on the averages of the 50 μm root sections. Asterisks indicate level of significance. Error bars represent standard deviation.
