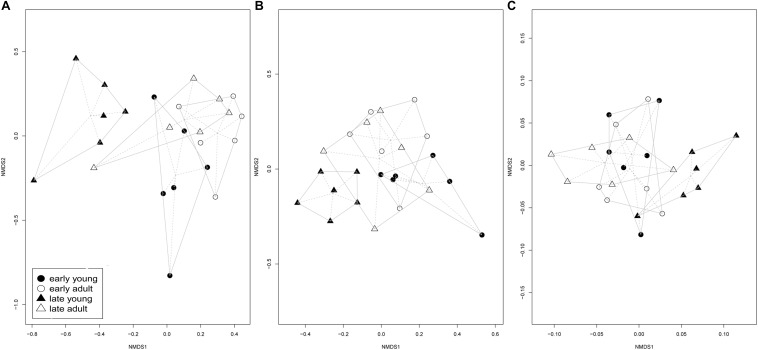
FIGURE 2.
Endophytic (A), saprotrophic (B) and pathogenic (C) fungal community ordination plots based on communities from early/late flushing and adult/young silver fir trees, calculated on a Bray-Curtis distance with a non-metric multidimensional scaling analysis (NMDS) ordination. Presented are centroids of each groups of samples. (A) Endophytic fungal community significantly differs between early and late flushing young silver fir trees (PERMANOVA, P = 0.006), but not between early and late flushing adult silver fir trees (PERMANOVA, P = 0.532). (B) The saprotrophic fungal community also significantly differed between early and late flushing young silver fir trees (PERMANOVA, P = 0.004), but not between early and late flushing adult silver fir trees (PERMANOVA, P = 0.401). (C) The same was revealed for the pathogenic fungal community, which significantly differed between early and late flushing young silver firs (PERMANOVA, P = 0.004), but not between early and late flushing adult silver fir trees (PERMANOVA, P = 0.935).

