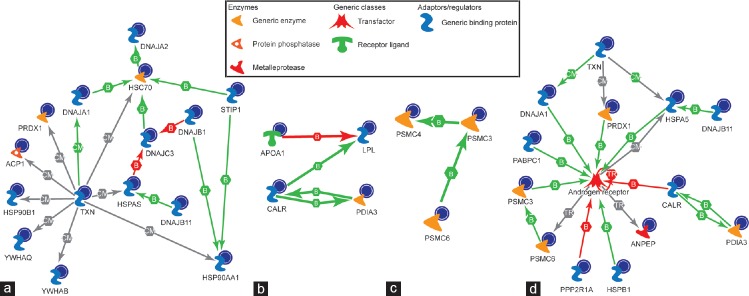
Figure 4.
The biochemical process networks of the differentially expressed proteins generated by MetaCore™ software using a transcription regulation algorithm. The biochemical process regulation networks were ranked by a value and interpreted in terms of GO. Gene network illustrates proteins and interactions of the differentially expressed proteins. MetaCore™ pathway analysis predicting androgen receptor as the major regulator and pathways involved were; (a) chaperone-mediated stress response; (b) sperm function; (c) proteosomal pathway; and (d) predicted impaired androgen receptor signaling in spermatozoa of infertile patients. GO: gene ontology; F1: least mature stage having the lowest density; F2, F3: intermediate stages; F4: includes the most dense and morphologically mature motile spermatozoa. Full names of abbreviated proteins are presented in Supplementary Information (39.6KB, pdf) .

