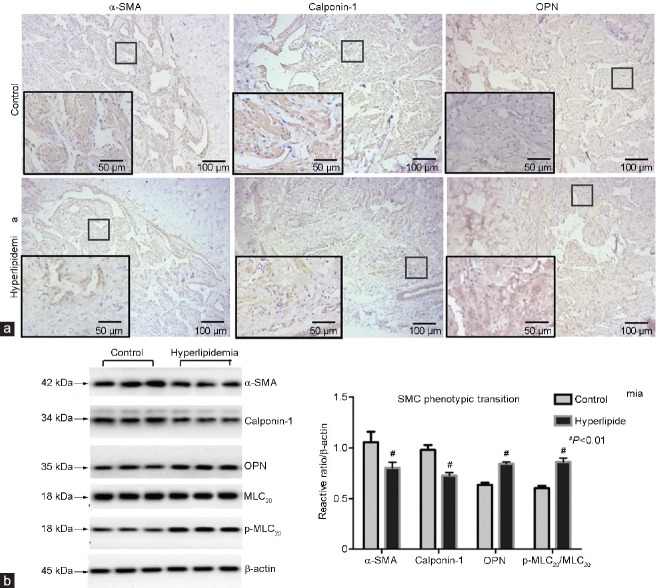
Figure 4.
(a) Immunohistochemical staining of penile cavernous tissues for α-SMA, calponin-1 and OPN in control and hyperlipidemia groups (magnification ×100, scale bars = 100 μm; ×200, scale bars = 50 μm). (b) Western blot analysis showed phenotypic transition in SMCs. Lanes 1–3: control; lanes 4–6: hyperlipidemia. Reduced expression of α-SMA and calponin-1 was demonstrated in hyperlipidemia samples. On the contrary, OPN and p-MLC20 were overexpressed in hyperlipidemia compared with control samples (n = 6 per group). #P < 0.01, hyperlipidemia group versus control group. α-SMA: smooth muscle α-actin; OPN: osteopontin; SMC: smooth muscle cell; p-MLC20: phospho-myosin light chain20.

