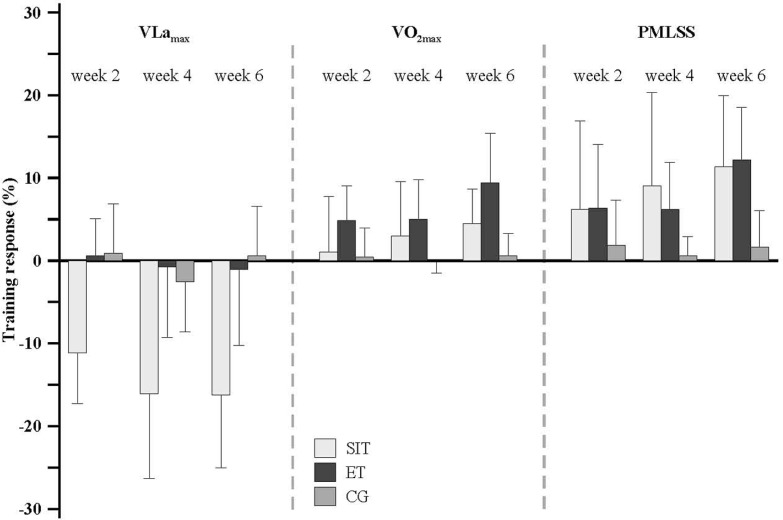
FIG 2.
Training response to SIT, ET and CG for VLamax, VO2max and PMLSS.
Note: Inter-participant variability is large for all groups and all parameters. But all participants of the SIT respond with reduction of VLamax (left). All participants of the ET respond with increase of VO2max (middle) and ET and SIT respond with increase of PMLSS after six weeks (right). Abbreviations: CG denotes control group; ET endurance training; PMLSS power in calculated maximal lactate steady state; SIT sprint interval training ; VLamax maximal lactate production rate; VO2max maximum oxygen consumption at maximum load.

