
Figure 2.
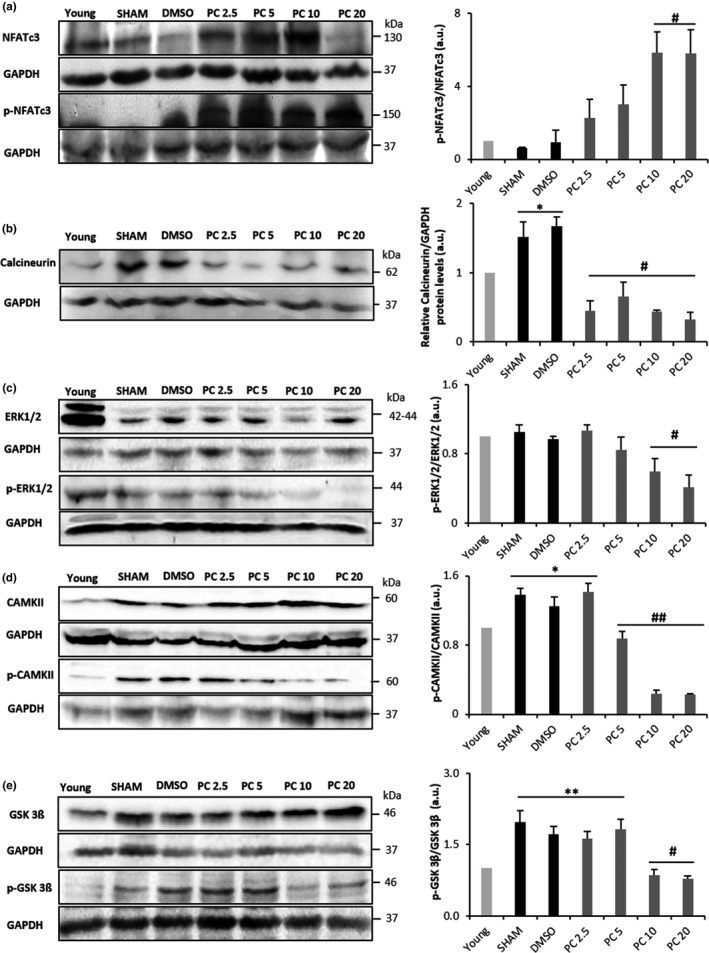
Modulation of age‐induced cardiac remodeling by phenolic compound consumption. Representative western blot (left) and histograms analyses (right) for NFAT (a), calcineurin (b), ERK1/2 (c), CAMKII (d), and GSK 3ß (e) in rat cardiac tissue, normalized to GAPDH (in arbitrary units, a.u.). Values represent mean ± SEM (n = 3 for each protein and condition). *p < 0.05 and **p < 0.01 vs. young, #p < 0.05 and ##p < 0.01 vs. SHAM and DMSO. PC x = phenolic compounds at x mg kg−1 day−1