
Figure 2.
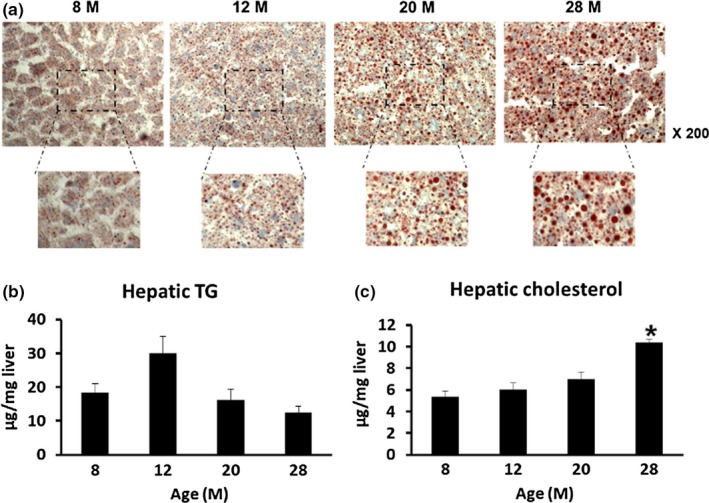
Changes in lipid accumulation in liver tissues at different ages of mice (n = 8–10/group). (a) Representative image of Oil Red O staining of liver tissue (Magnification; ×200). (b, c) The Folch method was used to separate lipids from liver tissue of various ages and to measure (b) hepatic TG levels and (c) hepatic cholesterol levels. *p < 0.05 vs. 8 M