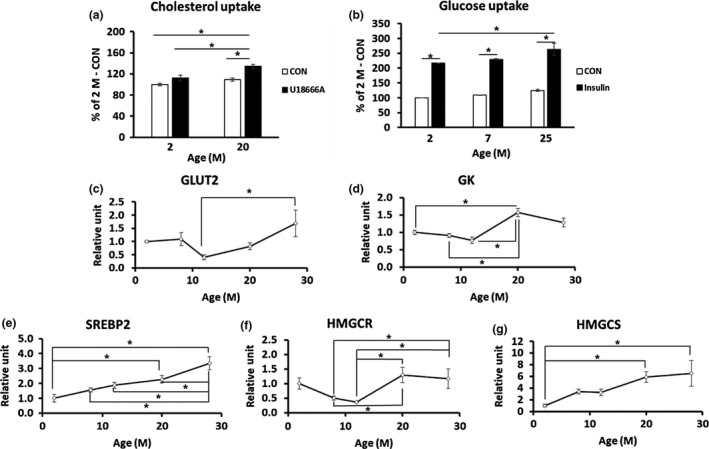
Figure 3.

Cholesterol uptake and glucose uptake cholesterol synthesis‐related gene expression were increased in aged mice (n = 3/group). (a, b) Primary hepatocytes were isolated from mouse livers at various ages, and cholesterol and glucose uptake were measured. (a) Cholesterol uptake was measured in the absence (CON) or presence of 1.25 μM U18666A, a cholesterol uptake inducer. (b) Glucose uptake was measured in the absence (CON) or presence of 1 μM insulin. (c, d) Total RNA was isolated from mouse livers at various ages, and qRT–PCR was carried out (n = 8–10/group). (c) GLUT2; (d) GK; (e) SREBP2; (f) 3‐hydroxy‐3‐methylglutaryl‐CoA reductase (HMGCR); (g) 3‐hydroxy‐3‐methylglutaryl‐CoA synthase 1 (HMGCS). *p < 0.05
