
Figure 3.
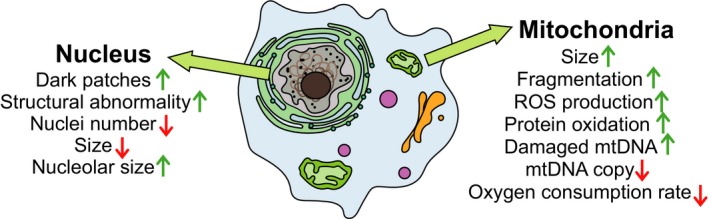
Age‐related changes at the cellular level. A schematic diagram that shows changes in the nuclei and mitochondria of old Caenorhabditis elegans cells
Official websites use .gov
A
.gov website belongs to an official
government organization in the United States.
Secure .gov websites use HTTPS
A lock (
) or https:// means you've safely
connected to the .gov website. Share sensitive
information only on official, secure websites.
Age‐related changes at the cellular level. A schematic diagram that shows changes in the nuclei and mitochondria of old Caenorhabditis elegans cells