
Figure 4.
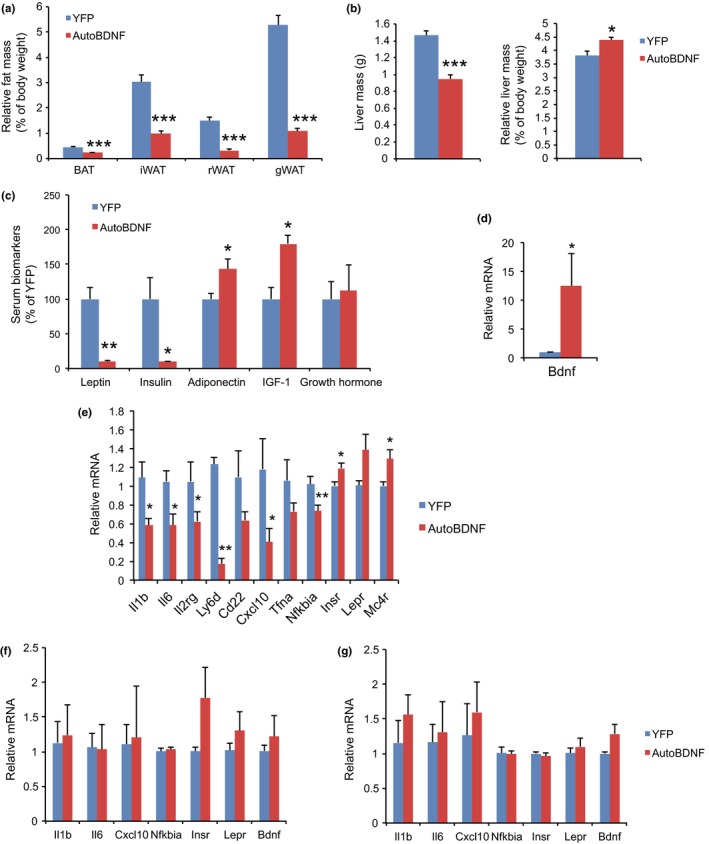
Tissue mass, serum biomarkers, and brain gene expression. (a) Relative fat mass at sacrifice 194 days post‐AAV injection. (b) Absolute (left) and relative (right) liver mass. (c) Serum biomarkers at sacrifice. (d) Hypothalamic BDNF expression. (e) Gene expression profiling of hypothalamus. (f) Gene expression profiling of amygdala. (g) Gene expression profiling of hippocampus. n = 8 for YFP, 9 for autoBDNF (a) to (c). n = 5 per group (d) to (g). Error bars represent mean ± SEM. *p < 0.05. **p < 0.01. ***p < 0.001