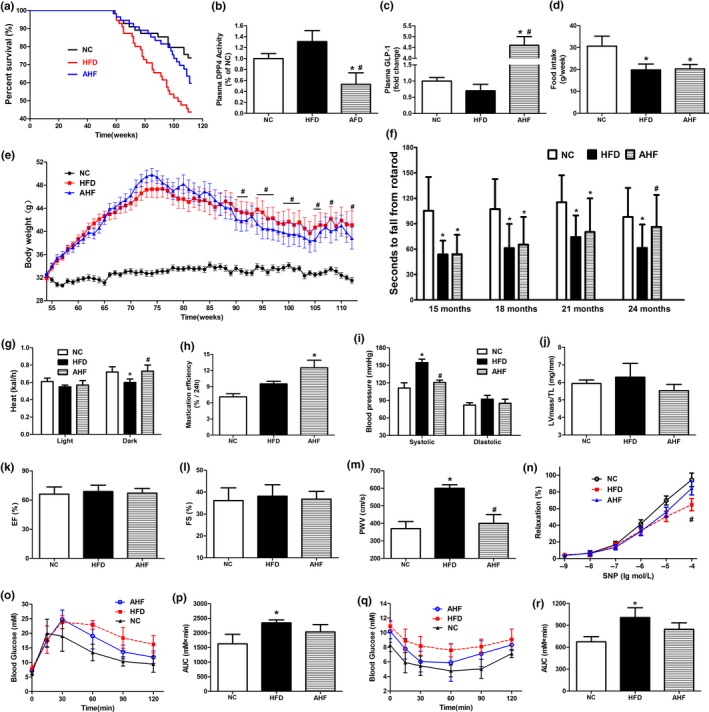
Figure 1.

Alogliptin intervention increases survival and improves physical performance. (a) Kaplan–Meier survival curves. Fifty‐five mice for each group. (b) DPP‐4 activity and (c) GLP‐1 protein level in plasma. (d) Food intake. (e) Body weight. Data are represented as mean ± 0.5 SD. (f) Time to fall from an accelerating rotarod. (g) Energy expenditure. (h) Mastication efficiency. (i) Blood pressure. (j) Ratio of left ventricular mass to tibia length (LV mass/TL). (k) Ejection fraction (EF). (l) Fractional shortening (FS). (m) PWV. (n) Endothelium‐independent vasodilation function of aortas in response to sodium nitroprusside (SNP). (o) IPGTT. (p) Area under IPGTT curve. (q) ITT. (r) Area under ITT curve. NC, normal chow. HFD, high‐fat diet. AHF, 0.03% (wt/wt) alogliptin plus HFD. Data are expressed as mean ± SD except where noted. *p < 0.05 compared with NC, # p < 0.05 compared with HFD
