Figure 2.

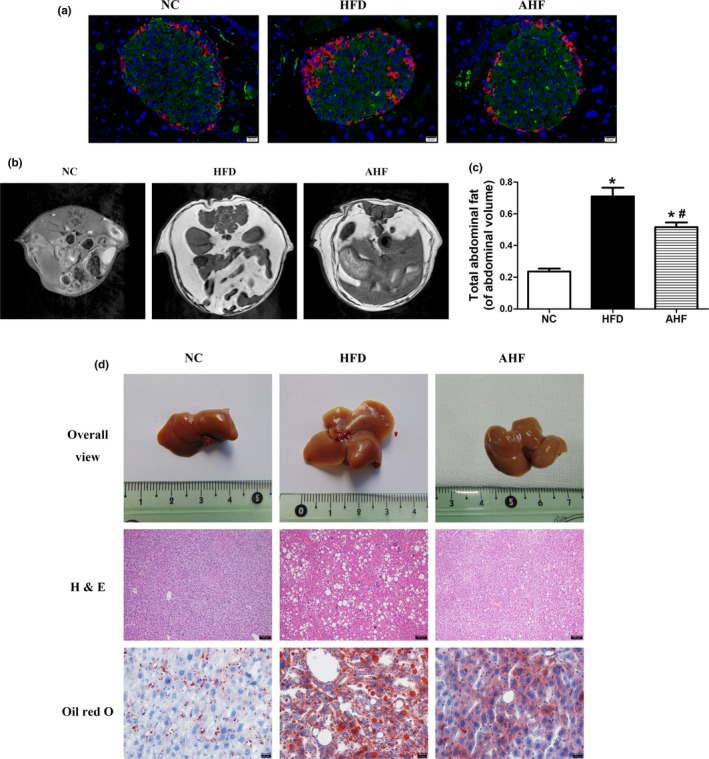
Alogliptin intervention improves organ pathology of pancreas and livers. (a) Representative images of pancreatic sections double‐stained for insulin (green) and glucagon (red), the nuclei were stained with DAPI (blue). Scale bar, 20 µm. (b)T1‐weighted spin‐echo images and (c) analysis of fat mass distribution. (d) Alogliptin intervention prevents the development of fatty liver as assessed by organ size and decreases fat accumulation as measured by hematoxylin‐eosin (H&E) staining (scale bar, 100 µm) and oil red O staining (scale bar, 20 µm). NC, normal chow. HFD, high‐fat diet. AHF, 0.03% (wt/wt) alogliptin plus HFD. Data are expressed as mean ± SD. *p < 0.05 compared with NC, # p < 0.05 compared with HFD
