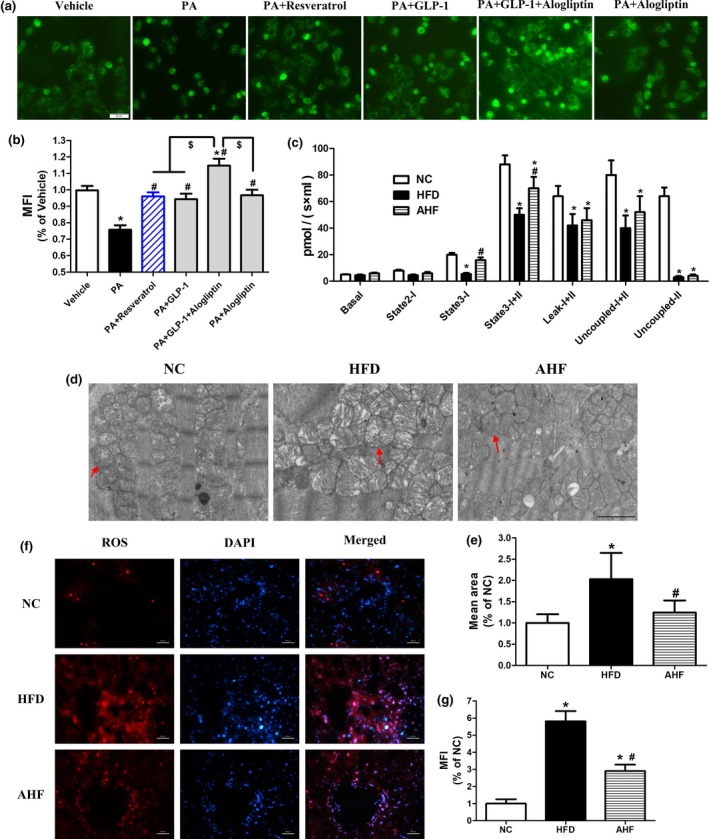
Figure 3.

Alogliptin intervention preserves mitochondrial function. (a) Primary hepatocytes were pretreated with PA (0.4 mM) for 24 hr, following added Alog (50 µM) or resveratrol (50 µM) for 30 min, finally added GLP‐1 (100 nM), if indicated, and incubated for another 24 hr without changing culture medium. Mitochondrial number was stained with Mitotracker Green FM. Scale bar, 50 µm. (b) Quantitative analysis of (a). (c) Oxygen consumptions at different mitochondrial stages of liver. (d) Representative transmission electron micrographs of heart. The red arrows indicate mitochondria. Scale bar, 2 µm. (e) Quantitative analysis of mitochondria mean area in (d). (f) Representative images of liver sections stained for ROS (red), the nuclei were stained with DAPI (blue). Scale bar, 50 µm. (g) Quantitative analysis of (f). MFI, mean fluorescence intensity; Basal, basal respiration; State 2‐I, state 2 respiration of Complex I; State 3‐I, state 3 respiration of Complex I; State 3‐I + II, state 3 respiration of both complex I and complex II; Leak‐I + II, leak respiration; Uncoupled‐I + II, uncoupling respiration; Uncoupled‐II, uncoupling respiration of complex II. NC, normal chow. HFD, high‐fat diet. AHF, 0.03% (wt/wt) alogliptin plus HFD. Data are expressed as mean ± SD. *p < 0.05 compared with NC, # p < 0.05 compared with HFD, $ p < 0.05. Each experiment repeated five times
