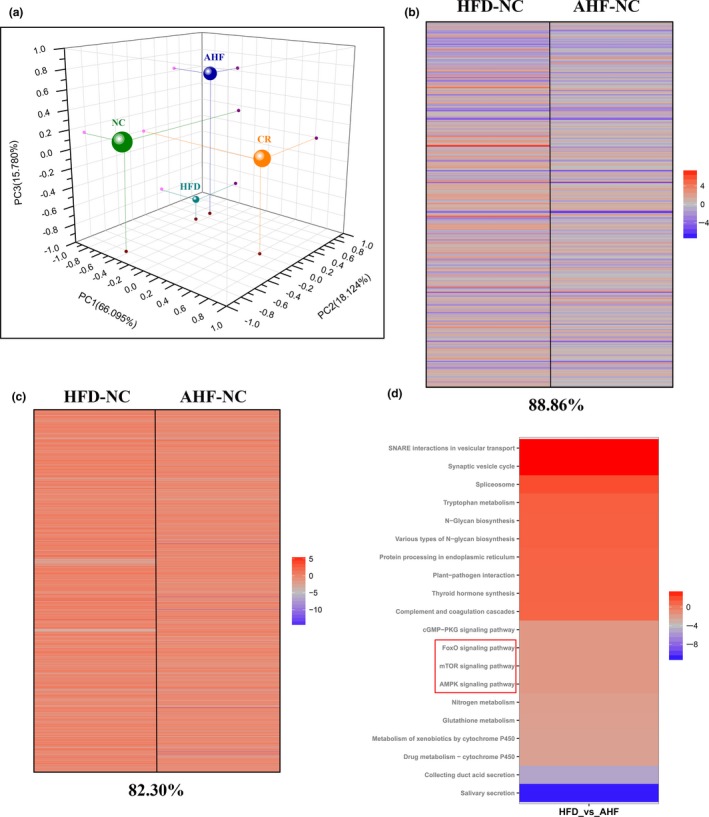
Figure 4.

Changes of transcriptome in the liver. (a) Principal component analysis (PCA) was performed based on differentially expressed genes from the liver. Each data point corresponds to the PCA analysis of each group. (b) Gene expression profile comparing genes significantly upregulated (red) and downregulated (blue) by either AHF or HFD compared with NC mice (fold‐change), and the complete list of significantly altered genes can be found in Supporting Information Table S1. The percentage of significant gene expression changes shifted in the same direction in AHF and HFD compared with NC mice is presented at the bottom of the figure. (c) Comparison of gene sets significantly altered by AHF and HFD treatment compared with NC expression (fpkm); upregulated (red) and downregulated (blue) gene sets. The complete list of significantly altered gene sets can be found in Supporting Information Table S2. The percentage of significant gene sets changes shifted in the same direction in AHF and HFD compared with NC is presented at the bottom of the figure. (d) Top 20 of the most up‐ and down‐regulated signaling pathways selected by Kyoto Encyclopedia of Genes and Genomes (KEGG) pathway analysis. NC, normal chow. HFD, high‐fat diet. AHF, 0.03% (wt/wt) alogliptin plus HFD. 3 mice per group
