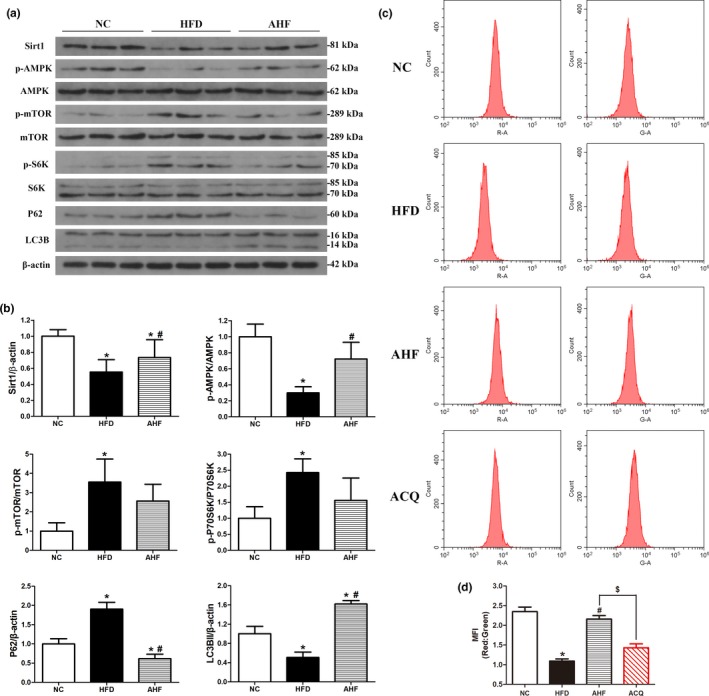
Figure 5.

Alogliptin intervention activates autophagy in vivo. (a) Western blots of total liver lysates for Sirt1, phosphorylated (p)‐AMPK, AMPK, p‐mTOR, mTOR, p‐S6K, S6K, p62, LC3B (LC3BII, 14 kDa). β‐Actin was used as a loading control. (b) Quantitative analysis of (a). (c) Mice were injected with adenovirus‐encoding mRFP‐GFP‐LC3 seven days before the end of the study, then the liver cells were isolated and assessed by flow cytometry. (d) Quantitative analysis of (c). MFI, mean fluorescence intensity. NC, normal chow. HFD, high‐fat diet. AHF, 0.03% (wt/wt) alogliptin plus HFD. AHQ, AHF plus CQ (chloroquine; 60 mg/kg, i.p. injection 6 hr before sacrificing the mice). Data are expressed as mean ± SD. *p < 0.05 compared with NC, # p < 0.05 compared with HFD, $ p < 0.05
