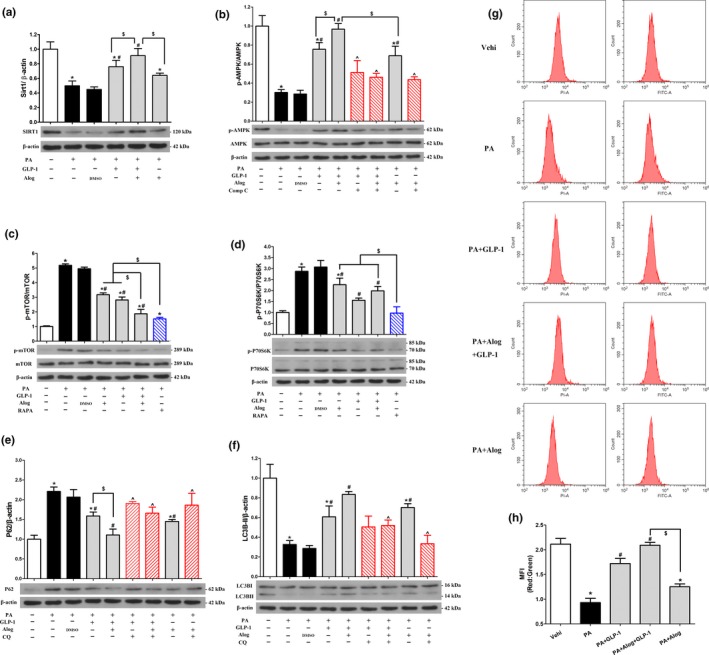
Figure 6.

Alogliptin administration stimulates autophagy in vitro. (a–f) Primary hepatocytes were pretreated with PA (0.4 mM) for 24 hr, and then added inhibitors [Compound C (20 µM), RAPA (1 µM) or CQ (10 µM)] for 30 min, following added Alog (50 µM) or DMSO (solvent of Alog) for 30 min, finally added GLP‐1 (100 nM) where indicated. After incubation without changing culture medium for another 24 hr, cells were harvested for Western blotting. Representative immunoblots and densitometric quantification for the expression of proteins Sirt1 (a), phosphorylated (p)‐AMPK (b), p‐mTOR (c), p‐S6K (d), p62 (e), and LC3B (LC3BII, 14 kDa) (f). (g‐h) Primary hepatocytes were pretreated with PA (0.4 mM) for 24 hr, and then added Alog (50 µM) for 30 min, following added GLP‐1 (100 nM), if indicated. Then, the cells were incubated without changing culture medium for another 24 hr. Adenoviruses encoding mRFP‐GFP‐LC3 were transfected 48 hr prior to harvest. (g) Representative graphs of flow cytometry. (h) Quantification of (g), *p < 0.05 compared with the Vehi (vehicle) group, # p < 0.05 compared with PA group, ^ p < 0.05 compared with corresponding groups without inhibitors, $ p < 0.05. PA, palmitic acid. RAPA, rapamycin. CQ, chloroquine. Data are expressed as mean ± SD. Each cell experiment repeated five times
