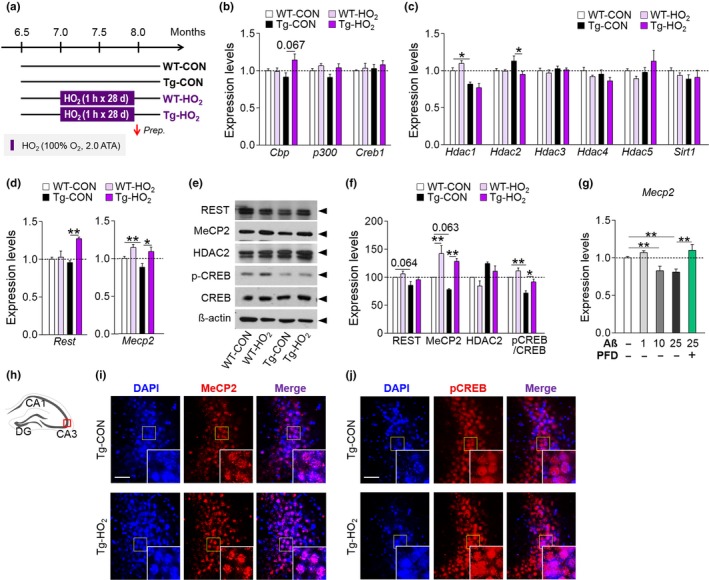
Figure 3.

HO2 increased MeCP2 and p‐CREB expression in the hippocampus of Tg‐APP/PS1 mice. (a) Experimental design. Mice were treated with HO2 (100% O2, 2 ATA) from 7 months of age for 1 hr daily for 28 days. Arrow, time point for tissue preparation. (b–d) Real‐time PCR data showing expression levels of Cbp, p300, Creb (b), Hdac1, Hdac2, Hdac3, Hdac4, Hdac5, Sirt1 (c), Rest, and Mecp2 (d) in the hippocampus of WT‐CON, WT‐HO2, Tg‐CON, and Tg‐HO2 mice. (e and f) Western blots showing expression levels of REST1, MeCP2, HDAC2, and p‐CREB (e) in the hippocampus of WT‐CON, WT‐HO2, Tg‐CON, and Tg‐HO2 mice. Quantification levels (f). (g) Real‐time PCR data showing expression levels of MeCP2 in HT22 cells treated with Aβ (25 μM) or Aβ(25 μM)plus PFD (20%). (h–j) Photomicrographs showing MeCP2 (i) and p‐CREB (j) expression in the CA3 region (h) of WT‐CON, WT‐HO2, Tg‐CON, and Tg‐HO2 mice. Insets, high magnification of the boxed areas. MeCP2 or p‐CREB, red; DAPI, blue. Scale bars, 50 μm. Data are presented as mean ± SEM. *p < 0.05; **p < 0.01 (one‐way ANOVA followed by Newman–Keuls post hoc test and two‐way ANOVA followed by Bonferroni post hoc test)
