Figure 4.

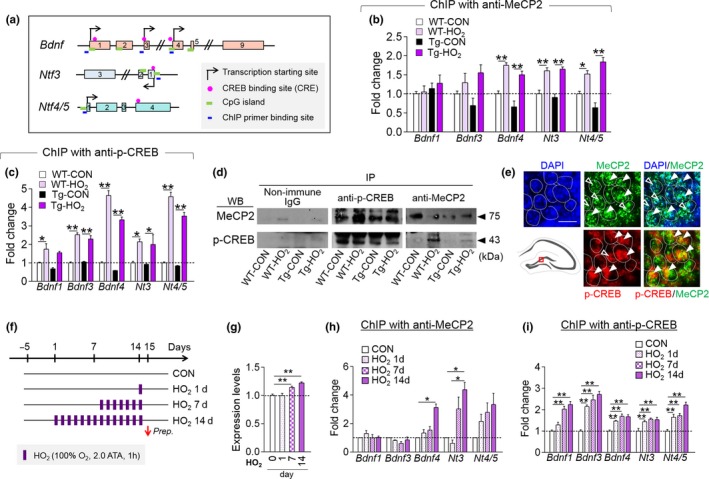
HO2 increased MeCP2 and p‐CREB binding to the promoter of neurotrophin genes. (a) Maps of the promoter region of Bdnf, Nt3, and Nt4/5 genes. Exons (box), transcription start sites, CRE, CpG islands, and ChIP PCR‐primer locations are indicated. (b,c) ChIP assays showing MeCP2 (b) and p‐CREB (c) binding to the promoter of Bdnf1, Bdnf3, Bdnf4, Nt3, Nt4/5 in the hippocampus of WT‐CON, WT‐HO2, Tg‐CON, and Tg‐HO2. (d) Western blots showing coimmunoprecipitation of MeCP2 and p‐CREB from the hippocampal tissue of WT‐CON, WT‐HO2, Tg‐CON, and Tg‐HO2. (e) Immunofluorescent images showing the colocalization of MeCP2 and p‐CREB in granule neurons of DG subregion (box in the diagram). MeCP2, green; p‐CREB, red; DAPI, blue. Scale bar, 20 μm. (f–i) Experimental design. Mice were treated with HO2 (100% O2, 2 ATA) for 1 hr daily for 1, 7, or 14 days (f). MeCP2 levels (g) and ChIP assay data showing MeCP2 (h) and p‐CREB (i) binding levels to the promoter of Bdnf1, Bdnf3, Bdnf4, Nt3, Nt4/5 in the hippocampus of mice treated with HO2 for indicated days. Data are presented as mean ± SEM. *p < 0.05; **p < 0.01 (one‐way ANOVA followed by Newman–Keuls post hoc test and two‐way ANOVA followed by Bonferroni post hoc test)
