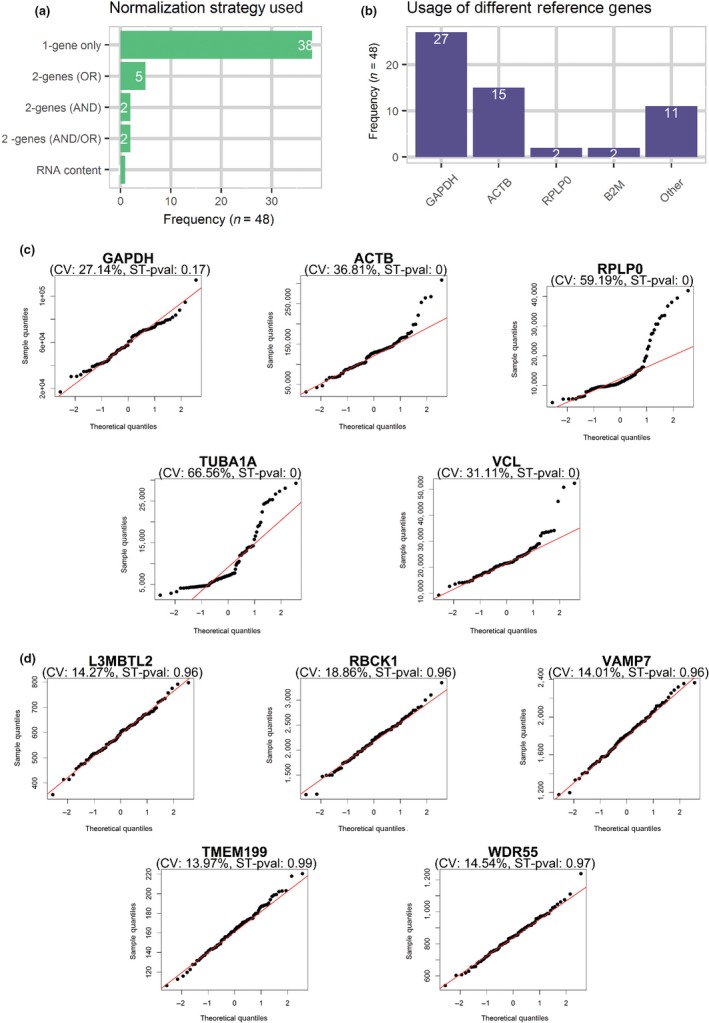
Figure 1.

Reference genes for qPCR experiments including senescent cells are poorly stable. (a) Bar plot showing the method of choice to normalize qPCR data in experiments that include senescent fibroblasts. 1‐gene only = only one reference gene used to normalize data, 2‐genes (OR) = two different reference genes used one at a time for different experiments, 2‐genes (AND) = two reference genes used together to calculate a normalization factor, 2‐genes (AND/OR) = two reference genes used either one at a time or together in different experiments, RNA content = RNA content per sample used to normalize qPCR data (n = 48 articles). (b) Bar plot showing reference genes used in experiments that include senescent fibroblasts (n = 48 articles). The usage of a gene was counted regardless if it was used alone or in combination with another reference gene. (c) Quantile–Quantile plots for the expression of five reference genes commonly used to normalize qPCR data of senescent fibroblasts as evaluated by public RNAseq datasets. A total of 99 samples from ten different datasets were used to build the plots. The calculated CV and the p‐value for the Shapiro–Wilk normality test (ST‐pval). (d) Quantile–Quantile plots for the top five reference gene candidates picked having the highest ST‐pval and a CV lower than 20. RNAseq data for different fibroblast strains were used in combination with c and d
