
Figure 2.
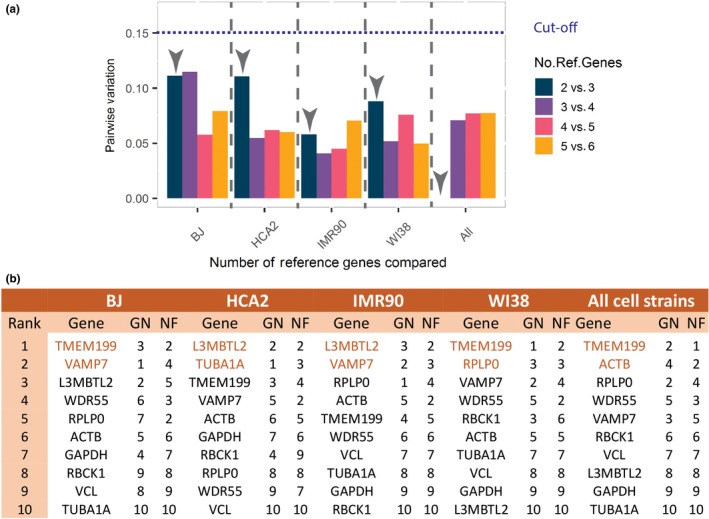
New candidates as reference genes to normalize qPCR data of senescent cells. The stability of the best reference gene was tested using qPCR data and the algorithms proposed by geNorm and NormFinder. (a) The normalization factor (geometric mean) using two, three, four, five, or six top reference genes were calculated for each cell type and for all cell types in combination (All). The performance of the different normalization factors was evaluated using geNorm. A difference in pairwise variation lower than 0.15 was used as a cutoff as recommended by Vandesompele et al. (2002). In all cases, two reference genes were sufficient for the calculation of the normalization factor. (b) Final ranking of the ten reference gene candidates tested by qPCR with both, geNorm (GN) and NormFinder (NF). Genes in orange mark the top two genes that were sufficient for the calculation of an adequate normalization factor