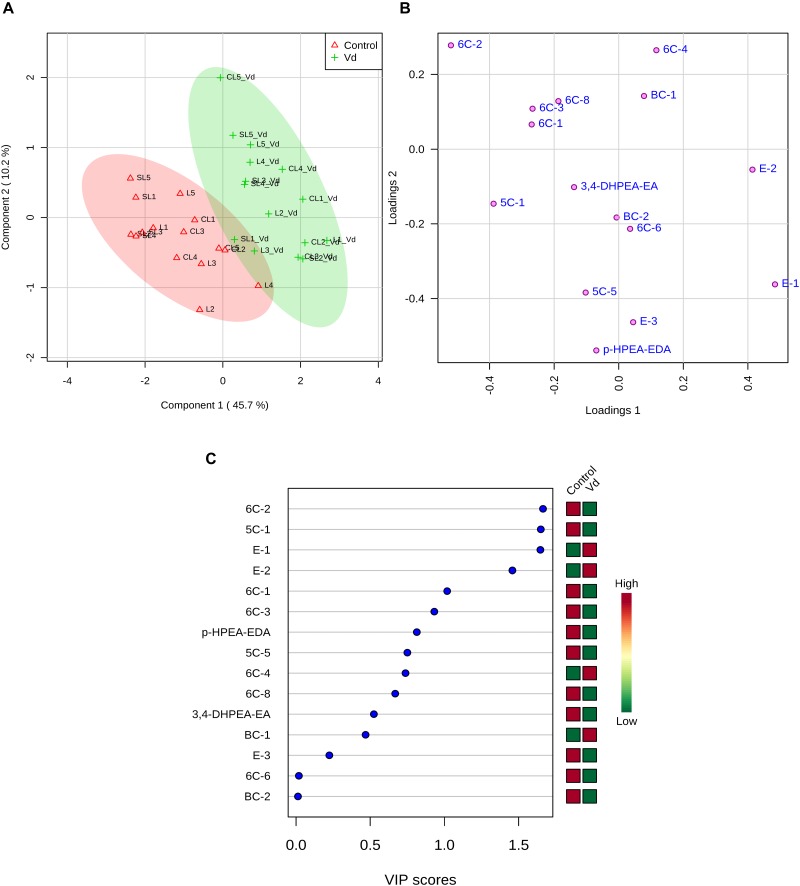
FIGURE 5.
(A) Sparse partial least square-discriminant analysis (PLS-DA) 2D score plot of volatile compounds with odor active values (OAV) > 1 and p-HPEA-EDA and 3,4- DHPEA-EA from oils extracted from olive trees grown in three different soils (L: loam; CL: clay-loam; and, SL: sandy-loam) infected (Vd) and non-infected (control) by D-Verticillium dahliae. Red: control; green: V. dahliae inoculated trees. The model was established using three principal components and explained variance is shown in parentheses. (B) Loadings between the selected PCs. (C) Loading importances of metabolites in the first PLS-DA component. Colored boxes (red: control; green: V. dahliae inoculated trees) indicate relative concentrations of the corresponding metabolite in each group.

