
Fig. 2.
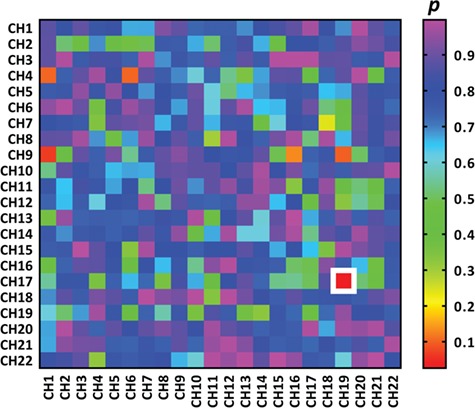
Heatmaps of the P-values (FDR corrected) for the one-way ANOVA using DYAD as the between-subject factor on the IBS increment of different CH combinations. The colors reflect P-values for the main effect of DYAD on the IBS increment of CH combinations. The white rectangle indicates that the main effect of DYAD on the IBS increment of the CH combination is less than 0.05. The vertical axis and horizontal axis represents CHs of different participants. It should be noted that significant difference in IBS increment among conditions was observed in the CH combination of CH17–CH19. The color bars denote the P-values.