
Fig. 4.
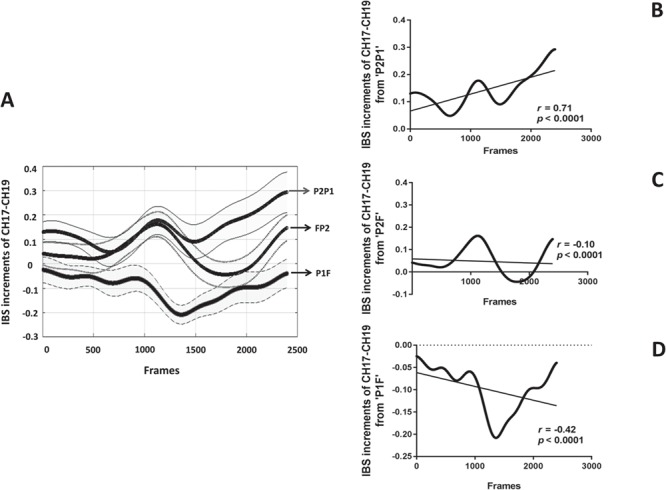
The trajectory of IBS increment of CH17–CH19 over time. (A) The IBS increments between participants (y-axis) is plotted against the frames (x-axis) for different dyads in the group (shaded areas: 95% confidence interval). (B) The correlation between the IBS increment of ‘P2P1’ and frames. (C) The correlation between the IBS increment of ‘FP2’ and frames. (D) The correlation between the IBS increment of ‘P1F’ and frames.