FIG. 2.

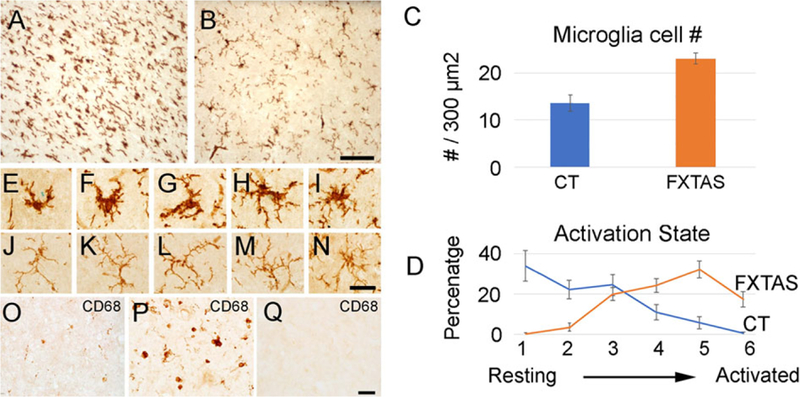
The number and state of activation of microglial cells is increased in FXTAS. (A) Representative images of Iba1+ microglial cells in the putamen in FXTAS (A) and control cases (B). (C) Microglial cell number is increased in FXTAS cases when compared to control cases. (D) The pattern of activation between the FXTAS and control cases was inverted, and microglial cells in FXTAS were more activated than in control cases. Blue: control; orange: FXTAS. (E–I) Activated microglial cells in the putamen of FXTAS cases. (J–N) Resting microglial cells in the putamen of control cases. (O–Q) CD68+ in senescent microglial cells (O), activated microglial cells (P), and control tissue (Q). Scale bar in (A,B): 100 μm; in (E–Q): 25 μm. [Color figure can be viewed at wileyonlinelibrary.com]
